-
In the genomic era, the identification of gene signatures associated with
disease is of significant interest. Such signatures are often used to predict
clinical outcomes in new patients and aid clinical decision-making. However,
recent studies have shown that gene signatures are often not replicable. This
occurrence has practical implications regarding the generalizability and
clinical applicability of such signatures. To improve replicability, we
introduce a novel approach to select gene signatures from multiple datasets
whose effects are consistently non-zero and account for between-study
heterogeneity. We build our model upon some rank-based quantities, facilitating
integration over different genomic datasets. A high dimensional penalized
Generalized Linear Mixed Model (pGLMM) is used to select gene signatures and
address data heterogeneity. We compare our method to some commonly used
strategies that select gene signatures ignoring between-study heterogeneity. We
provide asymptotic results justifying the performance of our method and
demonstrate its advantage in the presence of heterogeneity through thorough
simulation studies. Lastly, we motivate our method through a case study
subtyping pancreatic cancer patients from four gene expression studies.
-
To disentangle the complex non-stationary dependence structure of
precipitation extremes over the entire contiguous U.S., we propose a flexible
local approach based on factor copula models. Our sub-asymptotic spatial
modeling framework yields non-trivial tail dependence structures, with a
weakening dependence strength as events become more extreme, a feature commonly
observed with precipitation data but not accounted for in classical asymptotic
extreme-value models. To estimate the local extremal behavior, we fit the
proposed model in small regional neighborhoods to high threshold exceedances,
under the assumption of local stationarity, which allows us to gain in
flexibility. Adopting a local censored likelihood approach, inference is made
on a fine spatial grid, and local estimation is performed by taking advantage
of distributed computing resources and the embarrassingly parallel nature of
this estimation procedure. The local model is efficiently fitted at all grid
points, and uncertainty is measured using a block bootstrap procedure. An
extensive simulation study shows that our approach can adequately capture
complex, non-stationary dependencies, while our study of U.S. winter
precipitation data reveals interesting differences in local tail structures
over space, which has important implications on regional risk assessment of
extreme precipitation events.
-
Calibration of hydrological time-series models is a challenging task since
these models give a wide spectrum of output series and calibration procedures
require significant amount of time. From a statistical standpoint, this model
parameter estimation problem simplifies to finding an inverse solution of a
computer model that generates pre-specified time-series output (i.e., realistic
output series). In this paper, we propose a modified history matching approach
for calibrating the time-series rainfall-runoff models with respect to the real
data collected from the state of Georgia, USA. We present the methodology and
illustrate the application of the algorithm by carrying a simulation study and
the two case studies. Several goodness-of-fit statistics were calculated to
assess the model performance. The results showed that the proposed history
matching algorithm led to a significant improvement, of 30% and 14% (in terms
of root mean squared error) and 26% and 118% (in terms of peak percent
threshold statistics), for the two case-studies with Matlab-Simulink and SWAT
models, respectively.
-
Current health policy calls for greater use of evidence based care delivery
services to improve patient quality and safety outcomes. Care delivery is
complex, with interacting and interdependent components that challenge
traditional statistical analytic techniques, in particular when modeling a time
series of outcomes data that might be "interrupted" by a change in a particular
method of health care delivery. Interrupted time series (ITS) is a robust
quasi-experimental design with the ability to infer the effectiveness of an
intervention that accounts for data dependency. Current standardized methods
for analyzing ITS data do not model changes in variation and correlation
following the intervention. This is a key limitation since it is plausible for
data variability and dependency to change because of the intervention.
Moreover, present methodology either assumes a pre-specified interruption time
point with an instantaneous effect or removes data for which the effect of
intervention is not fully realized. In this paper, we describe and develop a
novel `Robust-ITS' model that overcomes these omissions and limitations. The
Robust-ITS model formally performs inference on: (a) identifying the change
point; (b) differences in pre- and post-intervention correlation; (c)
differences in the outcome variance pre- and post-intervention; and (d)
differences in the mean pre- and post-intervention. We illustrate the proposed
method by analyzing patient satisfaction data from a hospital that implemented
and evaluated a new nursing care delivery model as the intervention of
interest. The Robust-ITS model is implemented in a R Shiny toolbox which is
freely available to the community.
-
OBJECTIVE. A computer program tells me that a mean value is 12.3456789012,
but how many of these digits are significant (the rest being random junk)?
Should I report: 12.3?, 12.3456?, or even 10 (if only the first digit is
significant)? There are several rules-of-thumb but, surprisingly (given that
the problem is so common in science), none seem to be evidence-based. RESULTS.
Here I show how the significance of a digit in a particular decade of a mean
depends on the standard error of the mean (SEM). I define an index, DM that can
be plotted in graphs. From these a simple evidence-based rule for the number of
significant digits ("sigdigs") is distilled: the last sigdig in the mean is in
the same decade as the first or second non-zero digit in the SEM. As example,
for mean 34.63 (SEM 25.62), with n = 17, the reported value should be 35 (SEM
26). Digits beyond these contain little or no useful information, and should
not be reported lest they damage your credibility.
-
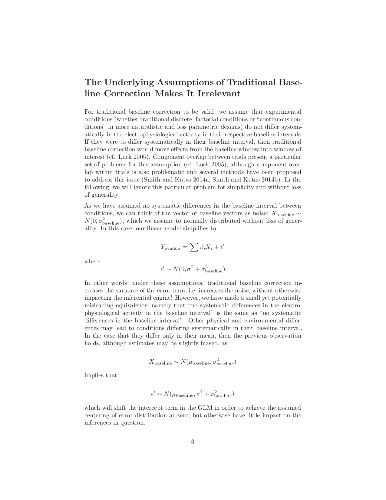
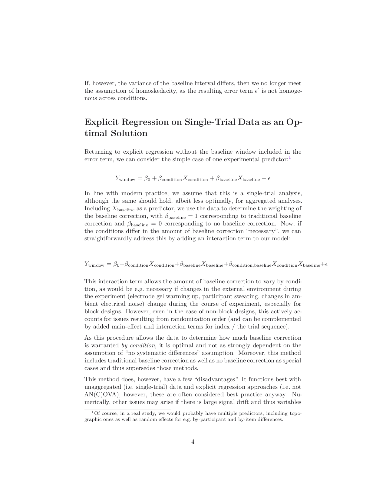
Baseline correction plays an important role in past and current
methodological debates in ERP research (e.g. the Tanner v. Maess debate in
Journal of Neuroscience Methods), serving as a potential alternative to strong
highpass filtering. However, the very assumptions that underlie traditional
baseline also undermine it, making it statistically unnecessary and even
undesirable and reducing signal-to-noise ratio. Including the baseline interval
as a predictor in a GLM-based statistical approach allows the data to determine
how much baseline correction is needed, including both full traditional and no
baseline correction as subcases, while reducing the amount of variance in the
residual error term and thus potentially increasing statistical power.
-
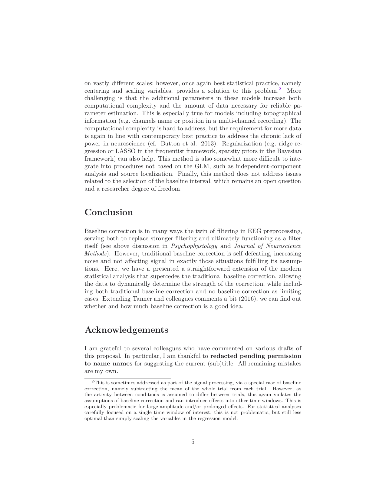
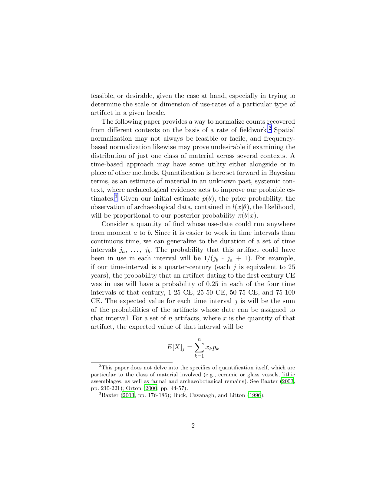
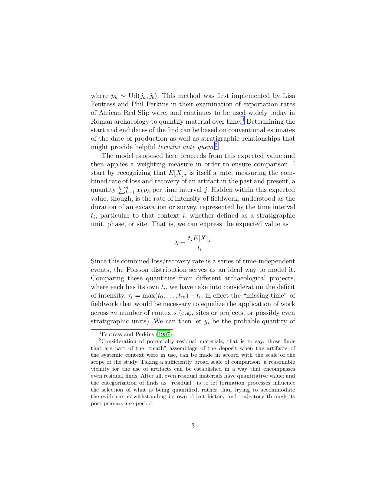
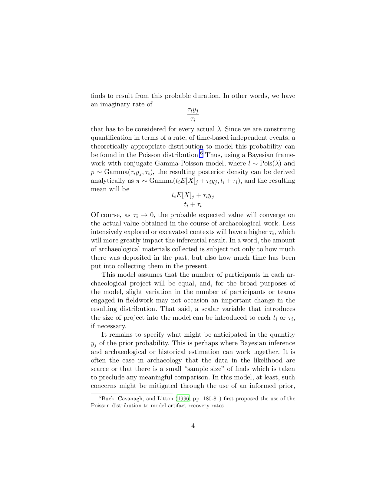
This article presents a new method for estimating the amount of an artifact
class in use at a given moment in the past from a random assemblage of
archaeological finds. This method is based on the use of simulation, since an
analytical solution is computationally impractical. Estimating the number of
artifacts in use at any time $t$ is shown to follow a Poisson distribution,
which allows for credible intervals to be established using the Jeffreys prior.
This estimator works from minimal assumptions about the dating and duration of
finds, as well as the intensity of collection, and is applied to coinage from
four Roman-period sites excavated by the Roman Peasant Project (2009-2014). The
result provides for an estimation of the abundance of material according to an
interval of certainty.
-
Count data and recurrent events in clinical trials, such as the number of
lesions in magnetic resonance imaging in multiple sclerosis, the number of
relapses in multiple sclerosis, the number of hospitalizations in heart
failure, and the number of exacerbations in asthma or in chronic obstructive
pulmonary disease (COPD) are often modeled by negative binomial distributions.
In this manuscript we study planning and analyzing clinical trials with group
sequential designs for negative binomial outcomes. We propose a group
sequential testing procedure for negative binomial outcomes based on Wald
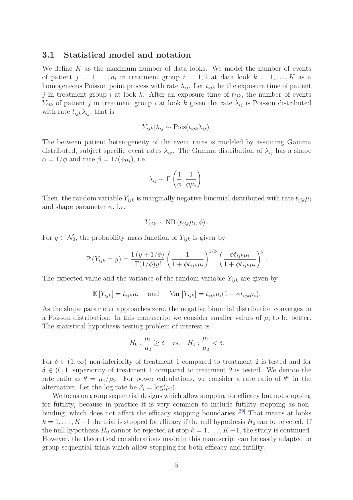
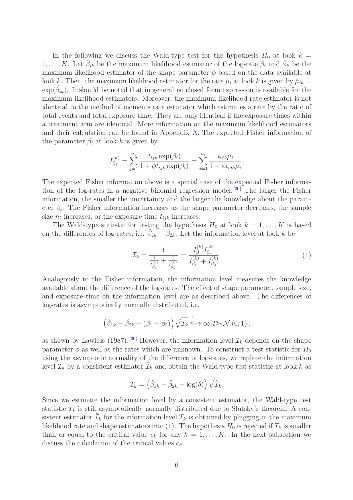
statistics using maximum likelihood estimators. The asymptotic distribution of
the proposed group sequential tests statistics are derived. The finite sample
size properties of the proposed group sequential test for negative binomial
outcomes and the methods for planning the respective clinical trials are
assessed in a simulation study. The simulation scenarios are motivated by
clinical trials in chronic heart failure and relapsing multiple sclerosis,
which cover a wide range of practically relevant settings. Our research assures
that the asymptotic normal theory of group sequential designs can be applied to
negative binomial outcomes when the hypotheses are tested using Wald statistics
and maximum likelihood estimators. We also propose two methods, one based on
Student's t-distribution and one based on resampling, to improve type I error
rate control in small samples. The statistical methods studied in this
manuscript are implemented in the R package \textit{gscounts}, which is
available for download on the Comprehensive R Archive Network (CRAN).
-
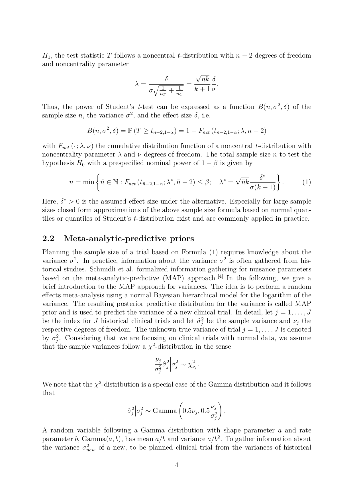
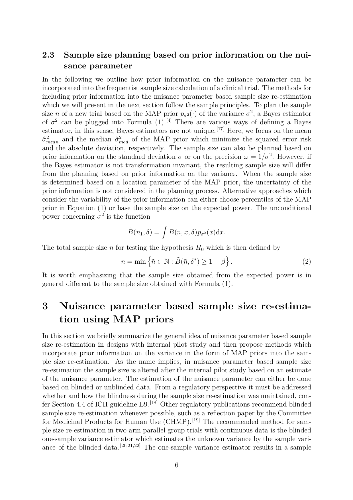
Prior information is often incorporated informally when planning a clinical
trial. Here, we present an approach on how to incorporate prior information,
such as data from historical clinical trials, into the nuisance parameter based
sample size re-estimation in a design with an internal pilot study. We focus on
trials with continuous endpoints in which the outcome variance is the nuisance
parameter. For planning and analyzing the trial frequentist methods are
considered. Moreover, the external information on the variance is summarized by
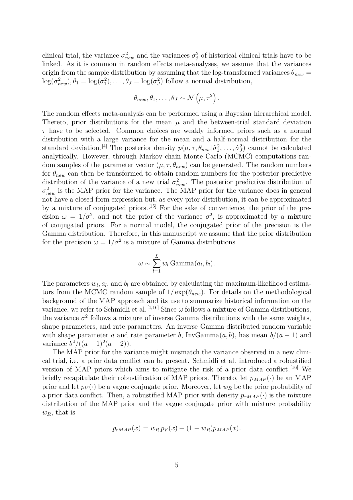
the Bayesian meta-analytic-predictive (MAP) approach. To incorporate external
information into the sample size re-estimation, we propose to update the MAP
prior based on the results of the internal pilot study and to re-estimate the
sample size using an estimator from the posterior. By means of a simulation
study, we compare the operating characteristics such as power and sample size
distribution of the proposed procedure with the traditional sample size
re-estimation approach which uses the pooled variance estimator. The simulation
study shows that, if no prior-data conflict is present, incorporating external
information into the sample size re-estimation improves the operating
characteristics compared to the traditional approach. In the case of a
prior-data conflict, that is when the variance of the ongoing clinical trial is
unequal to the prior location, the performance of the traditional sample size
re-estimation procedure is in general superior, even when the prior information
is robustified. When considering to include prior information in sample size
re-estimation, the potential gains should be balanced against the risks.
-
Goals are results of pin-point shots and it is a pivotal decision in soccer
when, how and where to shoot. The main contribution of this study is two-fold.
At first, after showing that there exists high spatial correlation in the data
of shots across games, we introduce a spatial process in the error structure to
model the probability of conversion from a shot depending on positional and
situational covariates. The model is developed using a full Bayesian framework.
Secondly, based on the proposed model, we define two new measures that can
appropriately quantify the impact of an individual in soccer, by evaluating the
positioning senses and shooting abilities of the players. As a practical
application, the method is implemented on Major League Soccer data from 2016/17
season.
-
The widespread use of generalized linear models in case-control genetic
studies has helped identify many disease-associated risk factors typically
defined as DNA variants, or single nucleotide polymorphisms (SNPs). Up to now,
most literature has focused on selecting a unique best subset of SNPs based on
some statistical perspectives. In the presence of pronounced noise, however,
multiple biological paths are often found to be equally supported by a given
dataset when dealing with complex genetic diseases. We address the ambiguity
related to SNP selection by constructing a list of models called variable
selection confidence set (VSCS), which contains the collection of all
well-supported SNP combinations at a user-specified confidence level. The VSCS
extends the familiar notion of confidence intervals in the variable selection
setting and provides the practitioner with new tools aiding the variable
selection activity beyond trusting a single model. Based on the VSCS, we
consider natural graphical and numerical statistics measuring the inclusion
importance of a SNP based on its frequency in the most parsimonious VSCS
models. This work is motivated by available case-control genetic data on
age-related macular degeneration, a widespread complex disease and leading
cause of vision loss.
-
A region under rainfall is a contiguous spatial area receiving positive
precipitation at a particular time. The probabilistic behavior of such a region
is an issue of interest in meteorological studies. A region under rainfall can
be viewed as a shape object of a special kind, where scale and rotational
invariance are not necessarily desirable attributes of a mathematical
representation. For modeling variation in objects of this type, we propose an
approximation of the boundary that can be represented as a real valued
function, and arrive at further approximation through functional principal
component analysis, after suitable adjustment for asymmetry and incompleteness
in the data. The analysis of an open access satellite data set on monsoon
precipitation over Eastern India leads to explanation of most of the variation
in shapes of the regions under rainfall through a handful of interpretable
functions that can be further approximated parametrically. The most important
aspect of shape is found to be the size followed by contraction/elongation,
mostly along two pairs of orthogonal axes. The different modes of variation are
remarkably stable across calendar years and across different thresholds for
minimum size of the region.
-
Quasi-Monte Carlo (QMC) method is a useful numerical tool for pricing and
hedging of complex financial derivatives. These problems are usually of high
dimensionality and discontinuities. The two factors may significantly
deteriorate the performance of the QMC method. This paper develops an
integrated method that overcomes the challenges of the high dimensionality and
discontinuities concurrently. For this purpose, a smoothing method is proposed
to remove the discontinuities for some typical functions arising from financial
engineering. To make the smoothing method applicable for more general
functions, a new path generation method is designed for simulating the paths of
the underlying assets such that the resulting function has the required form.
The new path generation method has an additional power to reduce the effective
dimension of the target function. Our proposed method caters for a large
variety of model specifications, including the Black-Scholes, exponential
normal inverse Gaussian L\'evy, and Heston models. Numerical experiments
dealing with these models show that in the QMC setting the proposed smoothing
method in combination with the new path generation method can lead to a
dramatic variance reduction for pricing exotic options with discontinuous
payoffs and for calculating options' Greeks. The investigation on the effective
dimension and the related characteristics explains the significant enhancement
of the combined procedure.
-
The statistics of the smallest eigenvalue of Wishart-Laguerre ensemble is
important from several perspectives. The smallest eigenvalue density is
typically expressible in terms of determinants or Pfaffians. These results are
of utmost significance in understanding the spectral behavior of
Wishart-Laguerre ensembles and, among other things, unveil the underlying
universality aspects in the asymptotic limits. However, obtaining exact and
explicit expressions by expanding determinants or Pfaffians becomes impractical
if large dimension matrices are involved. For the real matrices ($\beta=1$)
Edelman has provided an efficient recurrence scheme to work out exact and
explicit results for the smallest eigenvalue density which does not involve
determinants or matrices. Very recently, an analogous recurrence scheme has
been obtained for the complex matrices ($\beta=2$). In the present work we
extend this to $\beta$-Wishart-Laguerre ensembles for the case when exponent
$\alpha$ in the associated Laguerre weight function, $\lambda^\alpha
e^{-\beta\lambda/2}$, is a non-negative integer, while $\beta$ is positive
real. This also gives access to the smallest eigenvalue density of fixed trace
$\beta$-Wishart-Laguerre ensemble, as well as moments for both cases. Moreover,
comparison with earlier results for the smallest eigenvalue density in terms of
certain hypergeometric function of matrix argument results in an effective way
of evaluating these explicitly. Exact evaluations for large values of $n$ (the
matrix dimension) and $\alpha$ also enable us to compare with Tracy-Widom
density and large deviation results of Katzav and Castillo. We also use our
result to obtain the density of the largest of the proper delay times which are
eigenvalues of the Wigner-Smith matrix and are relevant to the problem of
quantum chaotic scattering.
-
Hypothesis testing in the linear regression model is a fundamental
statistical problem. We consider linear regression in the high-dimensional
regime where the number of parameters exceeds the number of samples ($p> n$).
In order to make informative inference, we assume that the model is
approximately sparse, that is the effect of covariates on the response can be
well approximated by conditioning on a relatively small number of covariates
whose identities are unknown. We develop a framework for testing very general
hypotheses regarding the model parameters. Our framework encompasses testing
whether the parameter lies in a convex cone, testing the signal strength, and
testing arbitrary functionals of the parameter. We show that the proposed
procedure controls the type I error, and also analyze the power of the
procedure. Our numerical experiments confirm our theoretical findings and
demonstrate that we control false positive rate (type I error) near the nominal
level, and have high power. By duality between hypotheses testing and
confidence intervals, the proposed framework can be used to obtain valid
confidence intervals for various functionals of the model parameters. For
linear functionals, the length of confidence intervals is shown to be minimax
rate optimal.
-
Data depth concept offers a variety of powerful and user friendly tools for
robust exploration and inference for multivariate socio-economic phenomena. The
offered techniques may be successfully used in cases of lack of our knowledge
on parametric models generating data due to their nonparametric nature. This
paper presents the R package DepthProc, which is available under GPL-2 licence
on CRAN and R-forge servers for Windows, Linux and OS X platform. The package
consist of among others successful implementations of several data depth
techniques involving multivariate quantile-quantile plots, multivariate scatter
estimators, local Wilcoxon tests for multivariate as well as for functional
data, robust regressions. In order to show the package capabilities, real
datasets concerning United Nations Fourth Millennium Goal and the Internet
users activity are used.
-
Glioblastoma multiforme (GBM) is an aggressive form of human brain cancer
that is under active study in the field of cancer biology. Its rapid
progression and the relative time cost of obtaining molecular data make other
readily-available forms of data, such as images, an important resource for
actionable measures in patients. Our goal is to utilize information given by
medical images taken from GBM patients in statistical settings. To do this, we
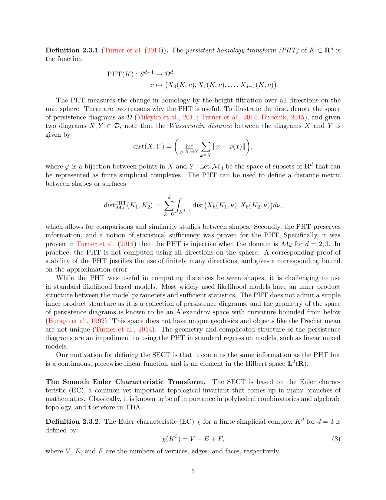
design a novel statistic---the smooth Euler characteristic transform
(SECT)---that quantifies magnetic resonance images (MRIs) of tumors. Due to its
well-defined inner product structure, the SECT can be used in a wider range of
functional and nonparametric modeling approaches than other previously proposed
topological summary statistics. When applied to a cohort of GBM patients, we
find that the SECT is a better predictor of clinical outcomes than both
existing tumor shape quantifications and common molecular assays. Specifically,
we demonstrate that SECT features alone explain more of the variance in GBM
patient survival than gene expression, volumetric features, and morphometric
features. The main takeaways from our findings are thus twofold. First, they
suggest that images contain valuable information that can play an important
role in clinical prognosis and other medical decisions. Second, they show that
the SECT is a viable tool for the broader study of medical imaging informatics.
-
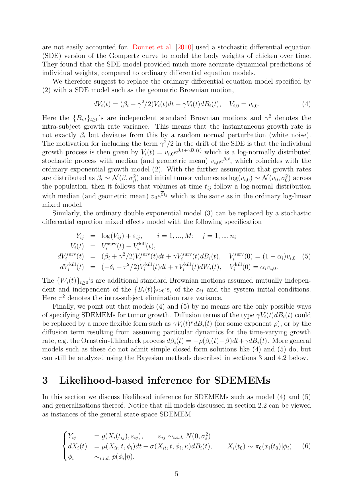
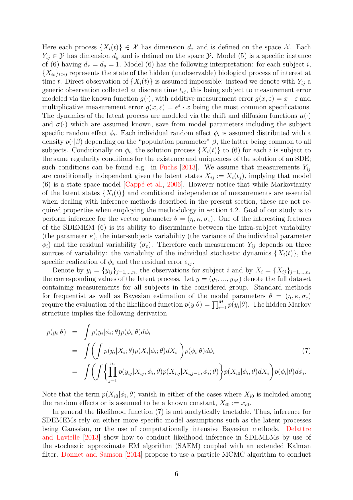
We consider Bayesian inference for stochastic differential equation mixed
effects models (SDEMEMs) exemplifying tumor response to treatment and regrowth
in mice. We produce an extensive study on how a SDEMEM can be fitted using both
exact inference based on pseudo-marginal MCMC and approximate inference via
Bayesian synthetic likelihoods (BSL). We investigate a two-compartments SDEMEM,
these corresponding to the fractions of tumor cells killed by and survived to a
treatment, respectively. Case study data considers a tumor xenography study
with two treatment groups and one control, each containing 5-8 mice. Results
from the case study and from simulations indicate that the SDEMEM is able to
reproduce the observed growth patterns and that BSL is a robust tool for
inference in SDEMEMs. Finally, we compare the fit of the SDEMEM to a similar
ordinary differential equation model. Due to small sample sizes, strong prior
information is needed to identify all model parameters in the SDEMEM and it
cannot be determined which of the two models is the better in terms of
predicting tumor growth curves. In a simulation study we find that with a
sample of 17 mice per group BSL is able to identify all model parameters and
distinguish treatment groups.
-
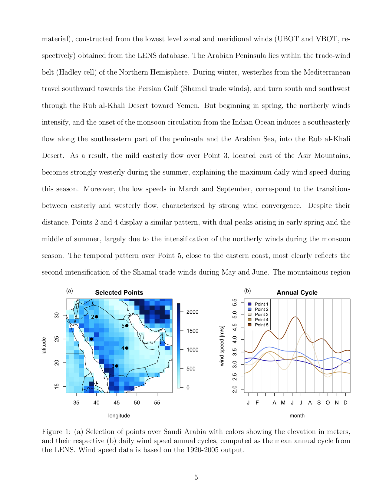
Facing increasing domestic energy consumption from population growth and
industrialization, Saudi Arabia is aiming to reduce its reliance on fossil
fuels and to broaden its energy mix by expanding investment in renewable energy
sources, including wind energy. A preliminary task in the development of wind
energy infrastructure is the assessment of wind energy potential, a key aspect
of which is the characterization of its spatio-temporal behavior. In this study
we examine the impact of internal climate variability on seasonal wind power
density fluctuations over Saudi Arabia using 30 simulations from the Large
Ensemble Project (LENS) developed at the National Center for Atmospheric
Research. Furthermore, a spatio-temporal model for daily wind speed is proposed
with neighbor-based cross-temporal dependence, and a multivariate skew-t
distribution to capture the spatial patterns of higher order moments. The model
can be used to generate synthetic time series over the entire spatial domain
that adequately reproduce the internal variability of the LENS dataset.
-
Brain function is organized in coordinated modes of spatio-temporal activity
(functional networks) exhibiting an intrinsic baseline structure with
variations under different experimental conditions. Existing approaches for
uncovering such network structures typically do not explicitly model shared and
differential patterns across networks, thus potentially reducing the detection
power. We develop an integrative modeling approach for jointly modeling
multiple brain networks across experimental conditions. The proposed Bayesian
Joint Network Learning approach develops flexible priors on the edge
probabilities involving a common intrinsic baseline structure and differential
effects specific to individual networks. Conditional on these edge
probabilities, connection strengths are modeled under a Bayesian spike and slab
prior on the off-diagonal elements of the inverse covariance matrix. The model
is fit under a posterior computation scheme based on Markov chain Monte Carlo.
Numerical simulations illustrate that the proposed joint modeling approach has
increased power to detect true differential edges while providing adequate
control on false positives and achieving greater accuracy in the estimation of
edge strengths compared to existing methods. An application of the method to
fMRI Stroop task data provides unique insights into brain network alterations
between cognitive conditions which existing graphical modeling techniques
failed to reveal.
-
The proliferation of terrorism is a serious concern in national and
international security, as its spread is seen as an existential threat to
Western liberal democracies. Understanding and effectively modelling the spread
of terrorism provides useful insight into formulating effective responses. A
mathematical model capturing the theoretical constructs of contagion and
diffusion is constructed for explaining the spread of terrorist activity and
used to analyse data from the Global Terrorism Database from 2000--2016 for
Afghanistan, Iraq, and Israel.
-
Consider the problem of estimating the entries of an unknown mean matrix or
tensor given a single noisy realization. In the matrix case, this problem can
be addressed by decomposing the mean matrix into a component that is additive
in the rows and columns, i.e.\ the additive ANOVA decomposition of the mean
matrix, plus a matrix of elementwise effects, and assuming that the elementwise
effects may be sparse. Accordingly, the mean matrix can be estimated by solving
a penalized regression problem, applying a lasso penalty to the elementwise
effects. Although solving this penalized regression problem is straightforward,
specifying appropriate values of the penalty parameters is not. Leveraging the
posterior mode interpretation of the penalized regression problem, moment-based
empirical Bayes estimators of the penalty parameters can be defined. Estimation
of the mean matrix using these these moment-based empirical Bayes estimators
can be called LANOVA penalization, and the corresponding estimate of the mean
matrix can be called the LANOVA estimate. The empirical Bayes estimators are
shown to be consistent. Additionally, LANOVA penalization is extended to
accommodate sparsity of row and column effects and to estimate an unknown mean
tensor. The behavior of the LANOVA estimate is examined under misspecification
of the distribution of the elementwise effects, and LANOVA penalization is
applied to several datasets, including a matrix of microarray data, a three-way
tensor of fMRI data and a three-way tensor of wheat infection data.
-
Cryo-electron microscopy provides 2-D projection images of the 3-D electron
scattering intensity of many instances of the particle under study (e.g., a
virus). Both symmetry (rotational point groups) and heterogeneity are important
aspects of biological particles and both aspects can be combined by describing
the electron scattering intensity of the particle as a stochastic process with
a symmetric probability law and therefore symmetric moments. A maximum
likelihood estimator implemented by an expectation-maximization algorithm is
described which estimates the unknown statistics of the electron scattering
intensity stochastic process from images of instances of the particle. The
algorithm is demonstrated on the bacteriophage HK97 and the virus N$\omega$V.
The results are contrasted with existing algorithms which assume that each
instance of the particle has the symmetry rather than the less restrictive
assumption that the probability law has the symmetry.
-
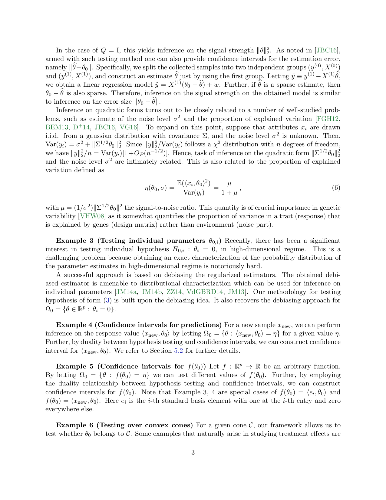
The functional linear regression model with points of impact is a recent
augmentation of the classical functional linear model with many practically
important applications. In this work, however, we demonstrate that the existing
data-driven procedure for estimating the parameters of this regression model
can be very instable and inaccurate. The tendency to omit relevant points of
impact is a particularly problematic aspect resulting in omitted-variable
biases. We explain the theoretical reason for this problem and propose a new
sequential estimation algorithm that leads to significantly improved estimation
results. Our estimation algorithm is compared with the existing estimation
procedure using an in-depth simulation study. The applicability is demonstrated
using data from Google AdWords, today's most important platform for online
advertisements. The \textsf{R}-package \texttt{FunRegPoI} and additional
\textsf{R}-codes are provided in the online supplementary material.
-
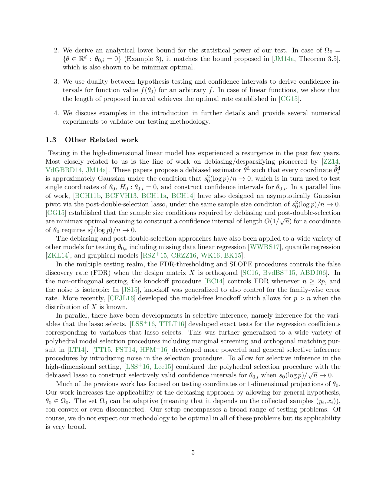
The method of model averaging has become an important tool to deal with model
uncertainty, for example in situations where a large amount of different
theories exist, as are common in economics. Model averaging is a natural and
formal response to model uncertainty in a Bayesian framework, and most of the
paper deals with Bayesian model averaging. The important role of the prior
assumptions in these Bayesian procedures is highlighted. In addition,
frequentist model averaging methods are also discussed. Numerical methods to
implement these methods are explained, and I point the reader to some freely
available computational resources. The main focus is on uncertainty regarding
the choice of covariates in normal linear regression models, but the paper also
covers other, more challenging, settings, with particular emphasis on sampling
models commonly used in economics. Applications of model averaging in economics
are reviewed and discussed in a wide range of areas, among which growth
economics, production modelling, finance and forecasting macroeconomic
quantities.

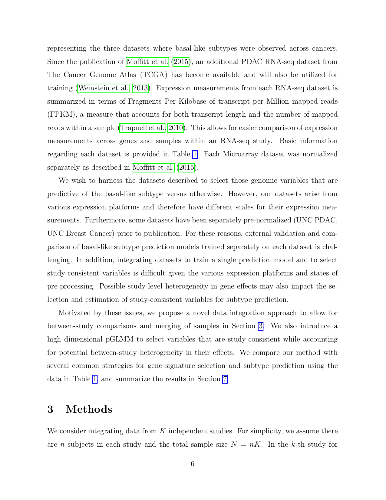 In the genomic era, the identification of gene signatures associated with disease is of significant interest. Such signatures are often used to predict clinical outcomes in new patients and aid clinical decision-making. However, recent studies have shown that gene signatures are often not replicable. This occurrence has practical implications regarding the generalizability and clinical applicability of such signatures. To improve replicability, we introduce a novel approach to select gene signatures from multiple datasets whose effects are consistently non-zero and account for between-study heterogeneity. We build our model upon some rank-based quantities, facilitating integration over different genomic datasets. A high dimensional penalized Generalized Linear Mixed Model (pGLMM) is used to select gene signatures and address data heterogeneity. We compare our method to some commonly used strategies that select gene signatures ignoring between-study heterogeneity. We provide asymptotic results justifying the performance of our method and demonstrate its advantage in the presence of heterogeneity through thorough simulation studies. Lastly, we motivate our method through a case study subtyping pancreatic cancer patients from four gene expression studies.
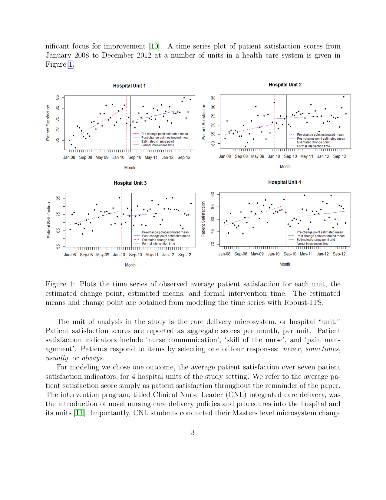
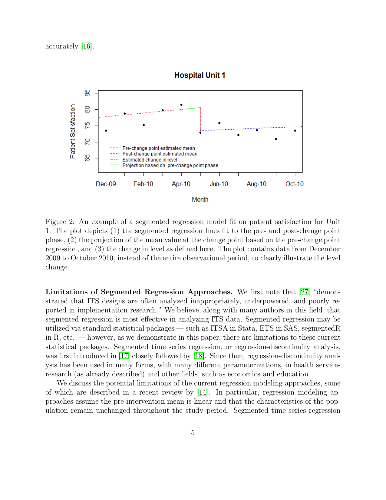
 Current health policy calls for greater use of evidence based care delivery services to improve patient quality and safety outcomes. Care delivery is complex, with interacting and interdependent components that challenge traditional statistical analytic techniques, in particular when modeling a time series of outcomes data that might be "interrupted" by a change in a particular method of health care delivery. Interrupted time series (ITS) is a robust quasi-experimental design with the ability to infer the effectiveness of an intervention that accounts for data dependency. Current standardized methods for analyzing ITS data do not model changes in variation and correlation following the intervention. This is a key limitation since it is plausible for data variability and dependency to change because of the intervention. Moreover, present methodology either assumes a pre-specified interruption time point with an instantaneous effect or removes data for which the effect of intervention is not fully realized. In this paper, we describe and develop a novel `Robust-ITS' model that overcomes these omissions and limitations. The Robust-ITS model formally performs inference on: (a) identifying the change point; (b) differences in pre- and post-intervention correlation; (c) differences in the outcome variance pre- and post-intervention; and (d) differences in the mean pre- and post-intervention. We illustrate the proposed method by analyzing patient satisfaction data from a hospital that implemented and evaluated a new nursing care delivery model as the intervention of interest. The Robust-ITS model is implemented in a R Shiny toolbox which is freely available to the community.

 Baseline correction plays an important role in past and current methodological debates in ERP research (e.g. the Tanner v. Maess debate in Journal of Neuroscience Methods), serving as a potential alternative to strong highpass filtering. However, the very assumptions that underlie traditional baseline also undermine it, making it statistically unnecessary and even undesirable and reducing signal-to-noise ratio. Including the baseline interval as a predictor in a GLM-based statistical approach allows the data to determine how much baseline correction is needed, including both full traditional and no baseline correction as subcases, while reducing the amount of variance in the residual error term and thus potentially increasing statistical power.
 This article presents a new method for estimating the amount of an artifact class in use at a given moment in the past from a random assemblage of archaeological finds. This method is based on the use of simulation, since an analytical solution is computationally impractical. Estimating the number of artifacts in use at any time $t$ is shown to follow a Poisson distribution, which allows for credible intervals to be established using the Jeffreys prior. This estimator works from minimal assumptions about the dating and duration of finds, as well as the intensity of collection, and is applied to coinage from four Roman-period sites excavated by the Roman Peasant Project (2009-2014). The result provides for an estimation of the abundance of material according to an interval of certainty.
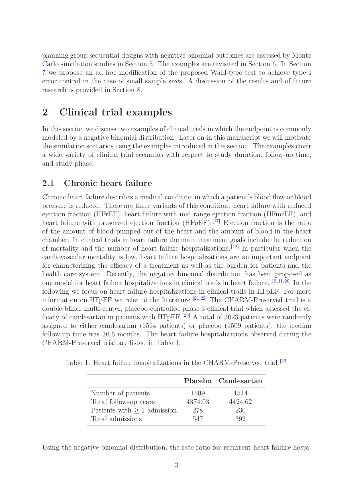
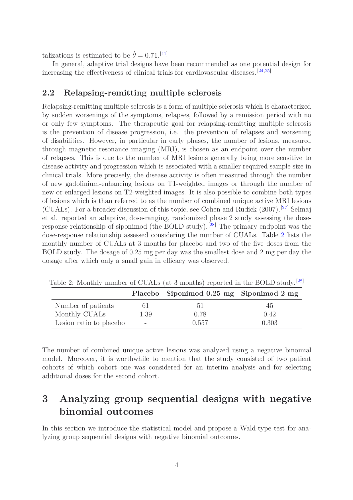
 Count data and recurrent events in clinical trials, such as the number of lesions in magnetic resonance imaging in multiple sclerosis, the number of relapses in multiple sclerosis, the number of hospitalizations in heart failure, and the number of exacerbations in asthma or in chronic obstructive pulmonary disease (COPD) are often modeled by negative binomial distributions. In this manuscript we study planning and analyzing clinical trials with group sequential designs for negative binomial outcomes. We propose a group sequential testing procedure for negative binomial outcomes based on Wald statistics using maximum likelihood estimators. The asymptotic distribution of the proposed group sequential tests statistics are derived. The finite sample size properties of the proposed group sequential test for negative binomial outcomes and the methods for planning the respective clinical trials are assessed in a simulation study. The simulation scenarios are motivated by clinical trials in chronic heart failure and relapsing multiple sclerosis, which cover a wide range of practically relevant settings. Our research assures that the asymptotic normal theory of group sequential designs can be applied to negative binomial outcomes when the hypotheses are tested using Wald statistics and maximum likelihood estimators. We also propose two methods, one based on Student's t-distribution and one based on resampling, to improve type I error rate control in small samples. The statistical methods studied in this manuscript are implemented in the R package \textit{gscounts}, which is available for download on the Comprehensive R Archive Network (CRAN).

 Prior information is often incorporated informally when planning a clinical trial. Here, we present an approach on how to incorporate prior information, such as data from historical clinical trials, into the nuisance parameter based sample size re-estimation in a design with an internal pilot study. We focus on trials with continuous endpoints in which the outcome variance is the nuisance parameter. For planning and analyzing the trial frequentist methods are considered. Moreover, the external information on the variance is summarized by the Bayesian meta-analytic-predictive (MAP) approach. To incorporate external information into the sample size re-estimation, we propose to update the MAP prior based on the results of the internal pilot study and to re-estimate the sample size using an estimator from the posterior. By means of a simulation study, we compare the operating characteristics such as power and sample size distribution of the proposed procedure with the traditional sample size re-estimation approach which uses the pooled variance estimator. The simulation study shows that, if no prior-data conflict is present, incorporating external information into the sample size re-estimation improves the operating characteristics compared to the traditional approach. In the case of a prior-data conflict, that is when the variance of the ongoing clinical trial is unequal to the prior location, the performance of the traditional sample size re-estimation procedure is in general superior, even when the prior information is robustified. When considering to include prior information in sample size re-estimation, the potential gains should be balanced against the risks.


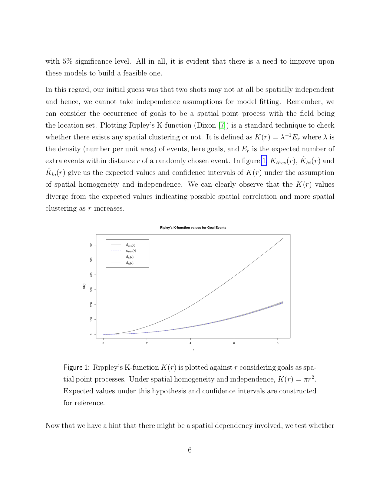 Goals are results of pin-point shots and it is a pivotal decision in soccer when, how and where to shoot. The main contribution of this study is two-fold. At first, after showing that there exists high spatial correlation in the data of shots across games, we introduce a spatial process in the error structure to model the probability of conversion from a shot depending on positional and situational covariates. The model is developed using a full Bayesian framework. Secondly, based on the proposed model, we define two new measures that can appropriately quantify the impact of an individual in soccer, by evaluating the positioning senses and shooting abilities of the players. As a practical application, the method is implemented on Major League Soccer data from 2016/17 season.

 The widespread use of generalized linear models in case-control genetic studies has helped identify many disease-associated risk factors typically defined as DNA variants, or single nucleotide polymorphisms (SNPs). Up to now, most literature has focused on selecting a unique best subset of SNPs based on some statistical perspectives. In the presence of pronounced noise, however, multiple biological paths are often found to be equally supported by a given dataset when dealing with complex genetic diseases. We address the ambiguity related to SNP selection by constructing a list of models called variable selection confidence set (VSCS), which contains the collection of all well-supported SNP combinations at a user-specified confidence level. The VSCS extends the familiar notion of confidence intervals in the variable selection setting and provides the practitioner with new tools aiding the variable selection activity beyond trusting a single model. Based on the VSCS, we consider natural graphical and numerical statistics measuring the inclusion importance of a SNP based on its frequency in the most parsimonious VSCS models. This work is motivated by available case-control genetic data on age-related macular degeneration, a widespread complex disease and leading cause of vision loss.
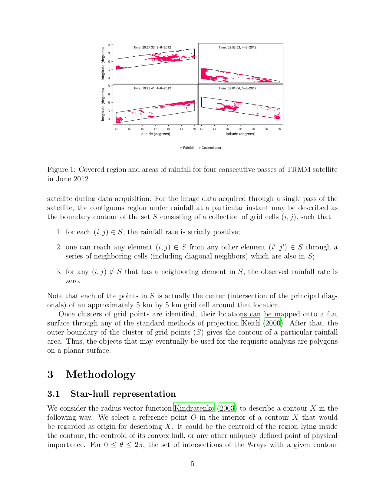
 A region under rainfall is a contiguous spatial area receiving positive precipitation at a particular time. The probabilistic behavior of such a region is an issue of interest in meteorological studies. A region under rainfall can be viewed as a shape object of a special kind, where scale and rotational invariance are not necessarily desirable attributes of a mathematical representation. For modeling variation in objects of this type, we propose an approximation of the boundary that can be represented as a real valued function, and arrive at further approximation through functional principal component analysis, after suitable adjustment for asymmetry and incompleteness in the data. The analysis of an open access satellite data set on monsoon precipitation over Eastern India leads to explanation of most of the variation in shapes of the regions under rainfall through a handful of interpretable functions that can be further approximated parametrically. The most important aspect of shape is found to be the size followed by contraction/elongation, mostly along two pairs of orthogonal axes. The different modes of variation are remarkably stable across calendar years and across different thresholds for minimum size of the region.
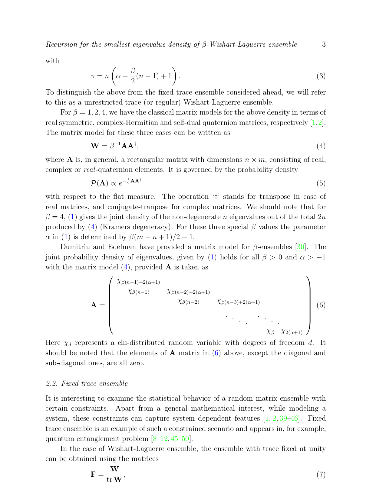


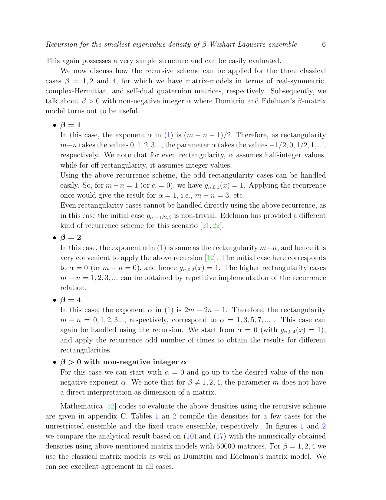 The statistics of the smallest eigenvalue of Wishart-Laguerre ensemble is important from several perspectives. The smallest eigenvalue density is typically expressible in terms of determinants or Pfaffians. These results are of utmost significance in understanding the spectral behavior of Wishart-Laguerre ensembles and, among other things, unveil the underlying universality aspects in the asymptotic limits. However, obtaining exact and explicit expressions by expanding determinants or Pfaffians becomes impractical if large dimension matrices are involved. For the real matrices ($\beta=1$) Edelman has provided an efficient recurrence scheme to work out exact and explicit results for the smallest eigenvalue density which does not involve determinants or matrices. Very recently, an analogous recurrence scheme has been obtained for the complex matrices ($\beta=2$). In the present work we extend this to $\beta$-Wishart-Laguerre ensembles for the case when exponent $\alpha$ in the associated Laguerre weight function, $\lambda^\alpha e^{-\beta\lambda/2}$, is a non-negative integer, while $\beta$ is positive real. This also gives access to the smallest eigenvalue density of fixed trace $\beta$-Wishart-Laguerre ensemble, as well as moments for both cases. Moreover, comparison with earlier results for the smallest eigenvalue density in terms of certain hypergeometric function of matrix argument results in an effective way of evaluating these explicitly. Exact evaluations for large values of $n$ (the matrix dimension) and $\alpha$ also enable us to compare with Tracy-Widom density and large deviation results of Katzav and Castillo. We also use our result to obtain the density of the largest of the proper delay times which are eigenvalues of the Wigner-Smith matrix and are relevant to the problem of quantum chaotic scattering.

 Hypothesis testing in the linear regression model is a fundamental statistical problem. We consider linear regression in the high-dimensional regime where the number of parameters exceeds the number of samples ($p> n$). In order to make informative inference, we assume that the model is approximately sparse, that is the effect of covariates on the response can be well approximated by conditioning on a relatively small number of covariates whose identities are unknown. We develop a framework for testing very general hypotheses regarding the model parameters. Our framework encompasses testing whether the parameter lies in a convex cone, testing the signal strength, and testing arbitrary functionals of the parameter. We show that the proposed procedure controls the type I error, and also analyze the power of the procedure. Our numerical experiments confirm our theoretical findings and demonstrate that we control false positive rate (type I error) near the nominal level, and have high power. By duality between hypotheses testing and confidence intervals, the proposed framework can be used to obtain valid confidence intervals for various functionals of the model parameters. For linear functionals, the length of confidence intervals is shown to be minimax rate optimal.
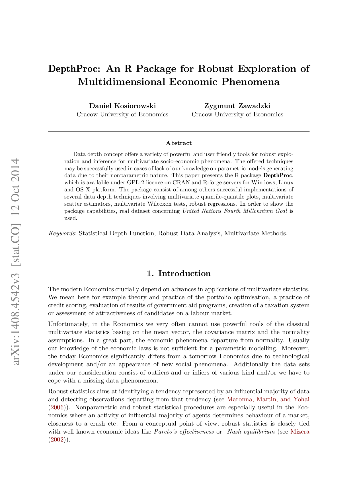
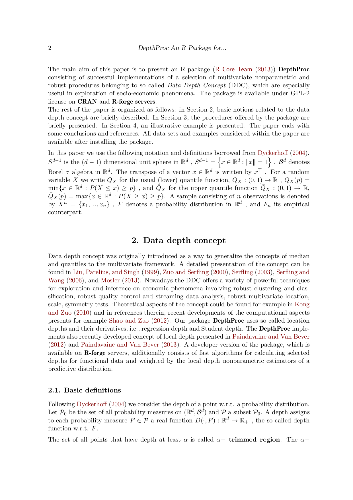

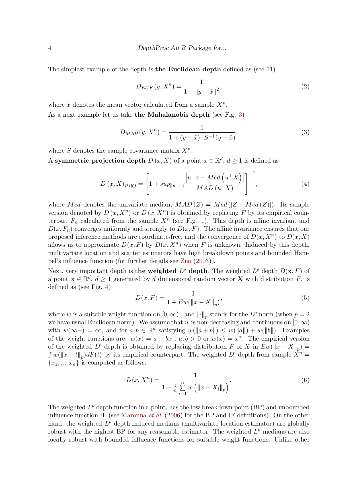
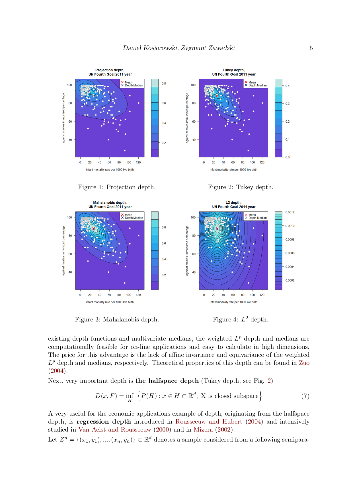
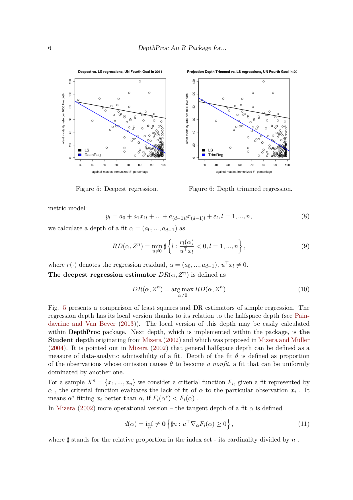 Data depth concept offers a variety of powerful and user friendly tools for robust exploration and inference for multivariate socio-economic phenomena. The offered techniques may be successfully used in cases of lack of our knowledge on parametric models generating data due to their nonparametric nature. This paper presents the R package DepthProc, which is available under GPL-2 licence on CRAN and R-forge servers for Windows, Linux and OS X platform. The package consist of among others successful implementations of several data depth techniques involving multivariate quantile-quantile plots, multivariate scatter estimators, local Wilcoxon tests for multivariate as well as for functional data, robust regressions. In order to show the package capabilities, real datasets concerning United Nations Fourth Millennium Goal and the Internet users activity are used.

 Glioblastoma multiforme (GBM) is an aggressive form of human brain cancer that is under active study in the field of cancer biology. Its rapid progression and the relative time cost of obtaining molecular data make other readily-available forms of data, such as images, an important resource for actionable measures in patients. Our goal is to utilize information given by medical images taken from GBM patients in statistical settings. To do this, we design a novel statistic---the smooth Euler characteristic transform (SECT)---that quantifies magnetic resonance images (MRIs) of tumors. Due to its well-defined inner product structure, the SECT can be used in a wider range of functional and nonparametric modeling approaches than other previously proposed topological summary statistics. When applied to a cohort of GBM patients, we find that the SECT is a better predictor of clinical outcomes than both existing tumor shape quantifications and common molecular assays. Specifically, we demonstrate that SECT features alone explain more of the variance in GBM patient survival than gene expression, volumetric features, and morphometric features. The main takeaways from our findings are thus twofold. First, they suggest that images contain valuable information that can play an important role in clinical prognosis and other medical decisions. Second, they show that the SECT is a viable tool for the broader study of medical imaging informatics.

 We consider Bayesian inference for stochastic differential equation mixed effects models (SDEMEMs) exemplifying tumor response to treatment and regrowth in mice. We produce an extensive study on how a SDEMEM can be fitted using both exact inference based on pseudo-marginal MCMC and approximate inference via Bayesian synthetic likelihoods (BSL). We investigate a two-compartments SDEMEM, these corresponding to the fractions of tumor cells killed by and survived to a treatment, respectively. Case study data considers a tumor xenography study with two treatment groups and one control, each containing 5-8 mice. Results from the case study and from simulations indicate that the SDEMEM is able to reproduce the observed growth patterns and that BSL is a robust tool for inference in SDEMEMs. Finally, we compare the fit of the SDEMEM to a similar ordinary differential equation model. Due to small sample sizes, strong prior information is needed to identify all model parameters in the SDEMEM and it cannot be determined which of the two models is the better in terms of predicting tumor growth curves. In a simulation study we find that with a sample of 17 mice per group BSL is able to identify all model parameters and distinguish treatment groups.


 Facing increasing domestic energy consumption from population growth and industrialization, Saudi Arabia is aiming to reduce its reliance on fossil fuels and to broaden its energy mix by expanding investment in renewable energy sources, including wind energy. A preliminary task in the development of wind energy infrastructure is the assessment of wind energy potential, a key aspect of which is the characterization of its spatio-temporal behavior. In this study we examine the impact of internal climate variability on seasonal wind power density fluctuations over Saudi Arabia using 30 simulations from the Large Ensemble Project (LENS) developed at the National Center for Atmospheric Research. Furthermore, a spatio-temporal model for daily wind speed is proposed with neighbor-based cross-temporal dependence, and a multivariate skew-t distribution to capture the spatial patterns of higher order moments. The model can be used to generate synthetic time series over the entire spatial domain that adequately reproduce the internal variability of the LENS dataset.

 Brain function is organized in coordinated modes of spatio-temporal activity (functional networks) exhibiting an intrinsic baseline structure with variations under different experimental conditions. Existing approaches for uncovering such network structures typically do not explicitly model shared and differential patterns across networks, thus potentially reducing the detection power. We develop an integrative modeling approach for jointly modeling multiple brain networks across experimental conditions. The proposed Bayesian Joint Network Learning approach develops flexible priors on the edge probabilities involving a common intrinsic baseline structure and differential effects specific to individual networks. Conditional on these edge probabilities, connection strengths are modeled under a Bayesian spike and slab prior on the off-diagonal elements of the inverse covariance matrix. The model is fit under a posterior computation scheme based on Markov chain Monte Carlo. Numerical simulations illustrate that the proposed joint modeling approach has increased power to detect true differential edges while providing adequate control on false positives and achieving greater accuracy in the estimation of edge strengths compared to existing methods. An application of the method to fMRI Stroop task data provides unique insights into brain network alterations between cognitive conditions which existing graphical modeling techniques failed to reveal.


 The proliferation of terrorism is a serious concern in national and international security, as its spread is seen as an existential threat to Western liberal democracies. Understanding and effectively modelling the spread of terrorism provides useful insight into formulating effective responses. A mathematical model capturing the theoretical constructs of contagion and diffusion is constructed for explaining the spread of terrorist activity and used to analyse data from the Global Terrorism Database from 2000--2016 for Afghanistan, Iraq, and Israel.
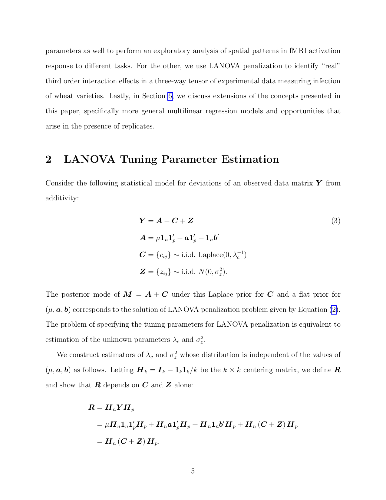
 Consider the problem of estimating the entries of an unknown mean matrix or tensor given a single noisy realization. In the matrix case, this problem can be addressed by decomposing the mean matrix into a component that is additive in the rows and columns, i.e.\ the additive ANOVA decomposition of the mean matrix, plus a matrix of elementwise effects, and assuming that the elementwise effects may be sparse. Accordingly, the mean matrix can be estimated by solving a penalized regression problem, applying a lasso penalty to the elementwise effects. Although solving this penalized regression problem is straightforward, specifying appropriate values of the penalty parameters is not. Leveraging the posterior mode interpretation of the penalized regression problem, moment-based empirical Bayes estimators of the penalty parameters can be defined. Estimation of the mean matrix using these these moment-based empirical Bayes estimators can be called LANOVA penalization, and the corresponding estimate of the mean matrix can be called the LANOVA estimate. The empirical Bayes estimators are shown to be consistent. Additionally, LANOVA penalization is extended to accommodate sparsity of row and column effects and to estimate an unknown mean tensor. The behavior of the LANOVA estimate is examined under misspecification of the distribution of the elementwise effects, and LANOVA penalization is applied to several datasets, including a matrix of microarray data, a three-way tensor of fMRI data and a three-way tensor of wheat infection data.
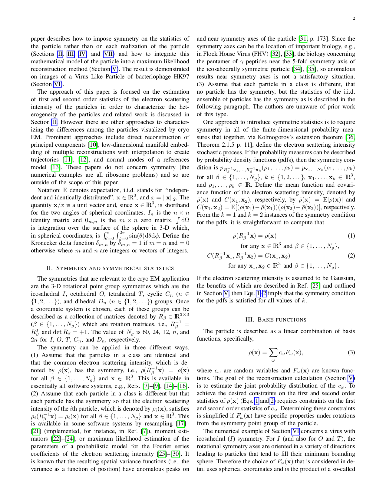
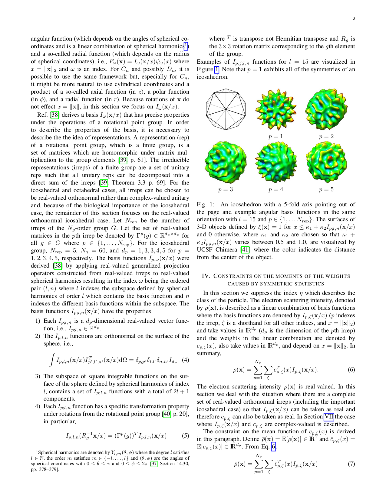
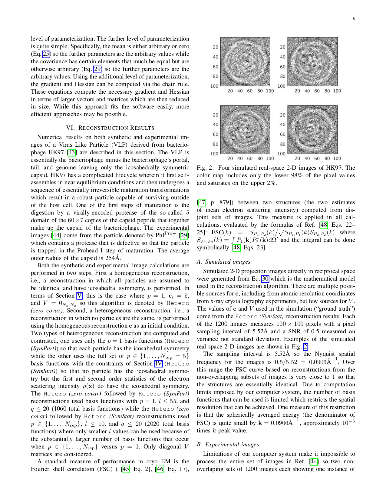 Cryo-electron microscopy provides 2-D projection images of the 3-D electron scattering intensity of many instances of the particle under study (e.g., a virus). Both symmetry (rotational point groups) and heterogeneity are important aspects of biological particles and both aspects can be combined by describing the electron scattering intensity of the particle as a stochastic process with a symmetric probability law and therefore symmetric moments. A maximum likelihood estimator implemented by an expectation-maximization algorithm is described which estimates the unknown statistics of the electron scattering intensity stochastic process from images of instances of the particle. The algorithm is demonstrated on the bacteriophage HK97 and the virus N$\omega$V. The results are contrasted with existing algorithms which assume that each instance of the particle has the symmetry rather than the less restrictive assumption that the probability law has the symmetry.