-
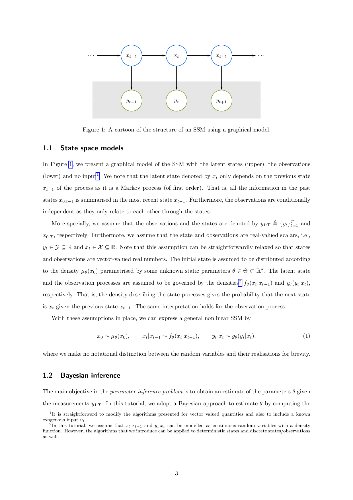
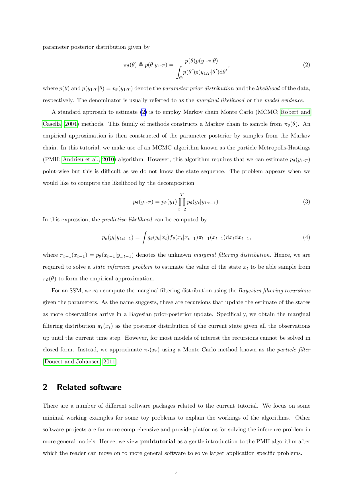
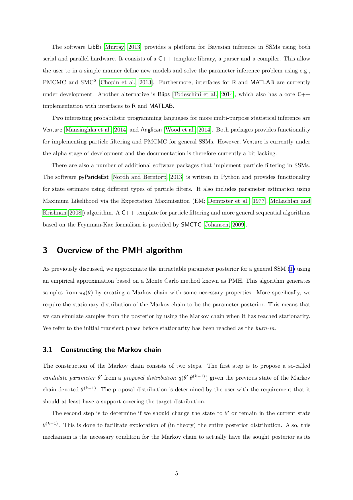
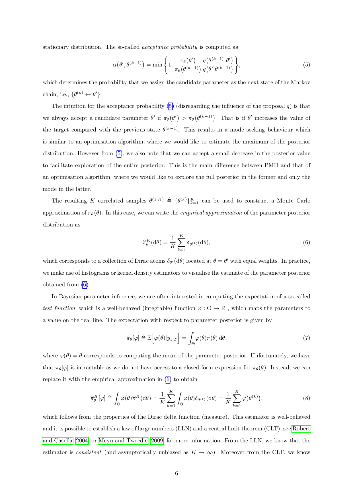
This tutorial provides a gentle introduction to the particle
Metropolis-Hastings (PMH) algorithm for parameter inference in nonlinear
state-space models together with a software implementation in the statistical
programming language R. We employ a step-by-step approach to develop an
implementation of the PMH algorithm (and the particle filter within) together
with the reader. This final implementation is also available as the package
pmhtutorial in the CRAN repository. Throughout the tutorial, we provide some
intuition as to how the algorithm operates and discuss some solutions to
problems that might occur in practice. To illustrate the use of PMH, we
consider parameter inference in a linear Gaussian state-space model with
synthetic data and a nonlinear stochastic volatility model with real-world
data.
-
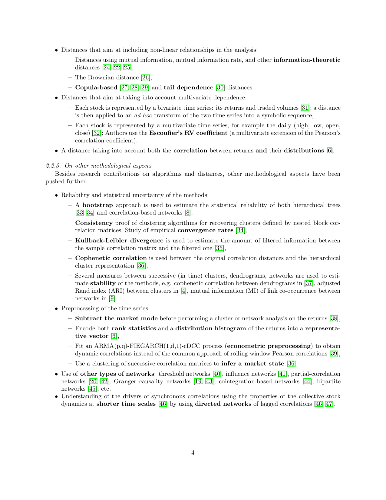
We review the state of the art of clustering financial time series and the
study of their correlations alongside other interaction networks. The aim of
this review is to gather in one place the relevant material from different
fields, e.g. machine learning, information geometry, econophysics, statistical
physics, econometrics, behavioral finance. We hope it will help researchers to
use more effectively this alternative modeling of the financial time series.
Decision makers and quantitative researchers may also be able to leverage its
insights. Finally, we also hope that this review will form the basis of an open
toolbox to study correlations, hierarchies, networks and clustering in
financial markets.
-
In this paper, we build tests for the presence of residual noise in a model
where the market microstructure noise is a known parametric function of some
variables from the limit order book. The tests compare two distinct
quasi-maximum likelihood estimators of volatility, where the related model
includes a residual noise in the market microstructure noise or not. The limit
theory is investigated in a general nonparametric framework. In the presence of
residual noise, we examine the central limit theory of the related
quasi-maximum likelihood estimation approach.
-
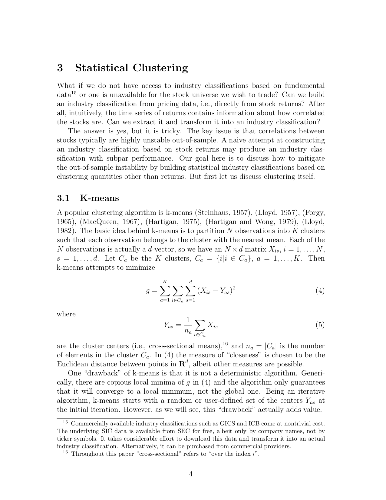
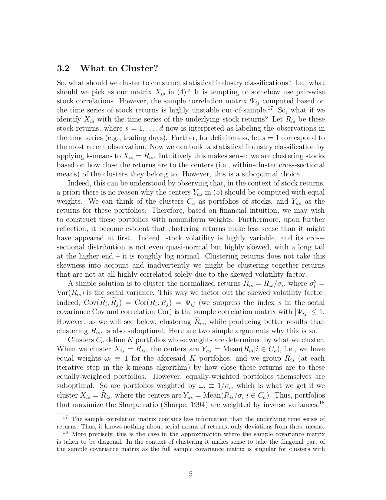
We give complete algorithms and source code for constructing (multilevel)
statistical industry classifications, including methods for fixing the number
of clusters at each level (and the number of levels). Under the hood there are
clustering algorithms (e.g., k-means). However, what should we cluster?
Correlations? Returns? The answer turns out to be neither and our backtests
suggest that these details make a sizable difference. We also give an algorithm
and source code for building "hybrid" industry classifications by improving
off-the-shelf "fundamental" industry classifications by applying our
statistical industry classification methods to them. The presentation is
intended to be pedagogical and geared toward practical applications in
quantitative trading.
-
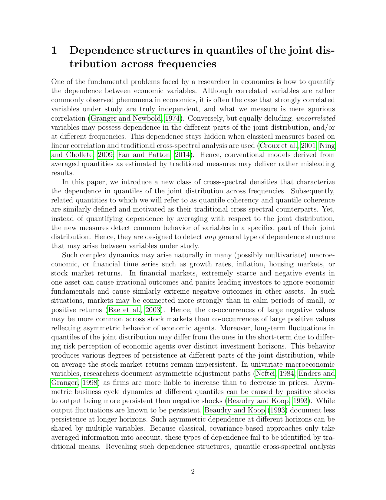
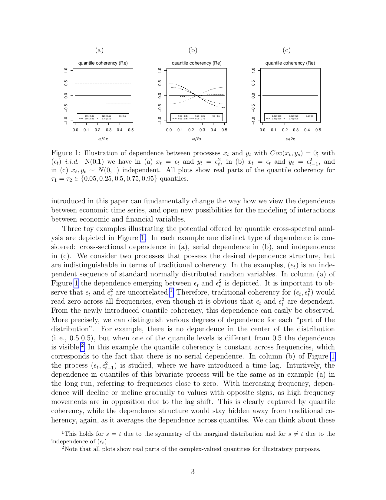
In this paper, we introduce quantile coherency to measure general dependence
structures emerging in the joint distribution in the frequency domain and argue
that this type of dependence is natural for economic time series but remains
invisible when only the traditional analysis is employed. We define estimators
which capture the general dependence structure, provide a detailed analysis of
their asymptotic properties and discuss how to conduct inference for a general
class of possibly nonlinear processes. In an empirical illustration we examine
the dependence of bivariate stock market returns and shed new light on
measurement of tail risk in financial markets. We also provide a modelling
exercise to illustrate how applied researchers can benefit from using quantile
coherency when assessing time series models.
-
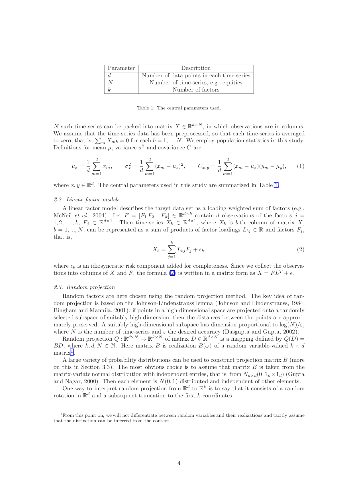
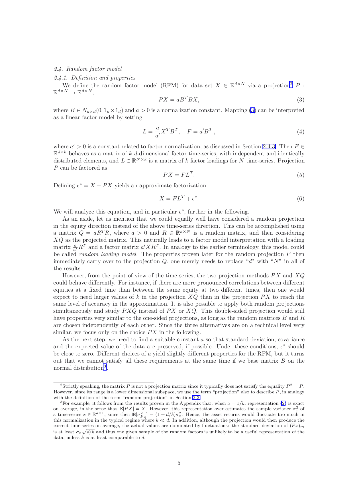
In a very high-dimensional vector space, two randomly-chosen vectors are
almost orthogonal with high probability. Starting from this observation, we
develop a statistical factor model, the random factor model, in which factors
are chosen at random based on the random projection method. Randomness of
factors has the consequence that covariance matrix is well preserved in a
linear factor representation. It also enables derivation of probabilistic
bounds for the accuracy of the random factor representation of time-series,
their cross-correlations and covariances. As an application, we analyze
reproduction of time-series and their cross-correlation coefficients in the
well-diversified Russell 3,000 equity index.
-
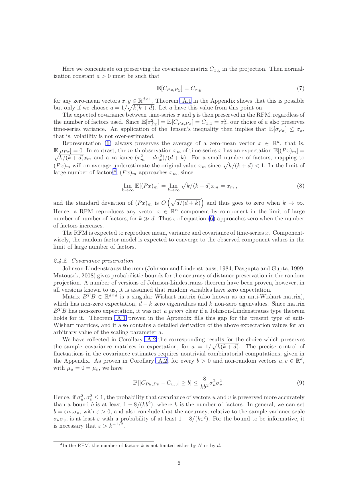
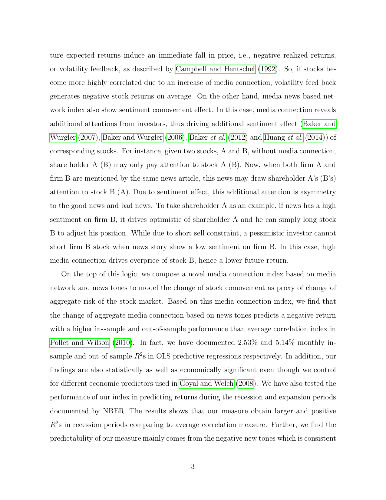
We examine the effect of investor attention spillover on stock return
predictability. Using a novel measure, the News Network Triggered Attention
index (NNTA), we find that NNTA negatively predicts market returns with a
monthly in(out)-of-sample R-square of 5.97% (5.80%). In the cross-section, a
long-short portfolio based on news co-occurrence generates a significant
monthly alpha of 68 basis points. The results are robust to the inclusion of
alternative attention proxies, sentiment measures, other news- and
information-based predictors, across recession and expansion periods. We
further validate the attention spillover effect by showing that news
co-mentioning leads to greater increases in Google and Bloomberg search volumes
than unconditional news coverage. Our findings suggest that attention spillover
in a news-based network can lead to significant stock market overvaluations,
and especially when arbitrage is limited.
-
Precise financial series predicting has long been a difficult problem because
of unstableness and many noises within the series. Although Traditional time
series models like ARIMA and GARCH have been researched and proved to be
effective in predicting, their performances are still far from satisfying.
Machine Learning, as an emerging research field in recent years, has brought
about many incredible improvements in tasks such as regressing and classifying,
and it's also promising to exploit the methodology in financial time series
predicting. In this paper, the predicting precision of financial time series
between traditional time series models and mainstream machine learning models
including some state-of-the-art ones of deep learning are compared through
experiment using real stock index data from history. The result shows that
machine learning as a modern method far surpasses traditional models in
precision.
-
A fundamental problem in studying and modeling economic and financial systems
is represented by privacy issues, which put severe limitations on the amount of
accessible information. Here we introduce a novel, highly nontrivial method to
reconstruct the structural properties of complex weighted networks of this kind
using only partial information: the total number of nodes and links, and the
values of the strength for all nodes. The latter are used as fitness to
estimate the unknown node degrees through a standard configuration model. Then,
these estimated degrees and the strengths are used to calibrate an enhanced
configuration model in order to generate ensembles of networks intended to
represent the real system. The method, which is tested on real economic and
financial networks, while drastically reducing the amount of information needed
to infer network properties, turns out to be remarkably effective$-$thus
representing a valuable tool for gaining insights on privacy-protected
socioeconomic systems.
-
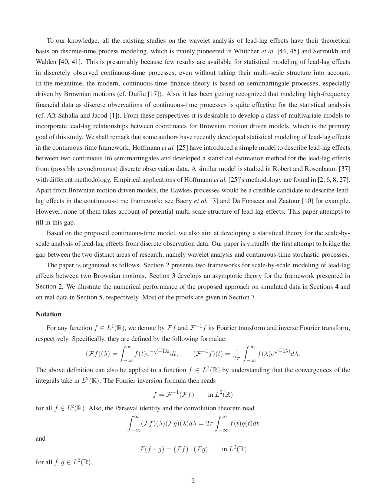
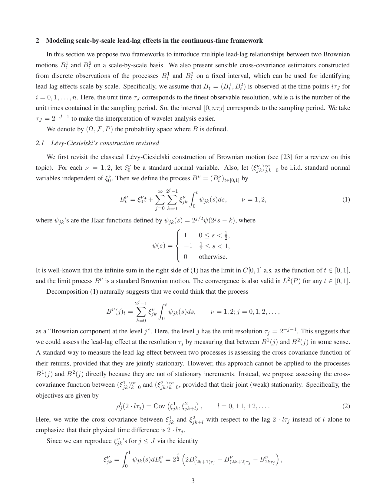
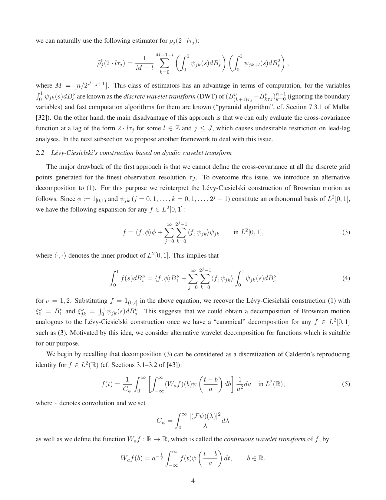
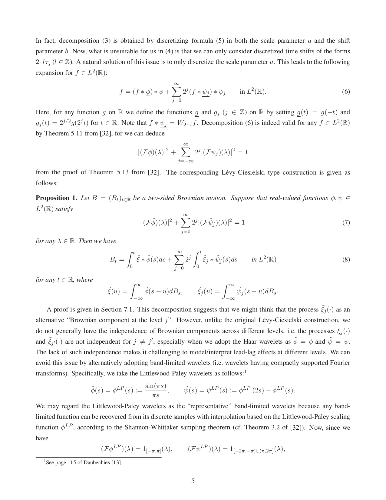
We propose a novel framework to investigate lead-lag relationships between
two financial assets. Our framework bridges a gap between continuous-time
modeling based on Brownian motion and the existing wavelet methods for lead-lag
analysis based on discrete-time models and enables us to analyze the
multi-scale structure of lead-lag effects. We also present a statistical
methodology for the scale-by-scale analysis of lead-lag effects in the proposed
framework and develop an asymptotic theory applicable to a situation including
stochastic volatilities and irregular sampling. Finally, we report several
numerical experiments to demonstrate how our framework works in practice.
-
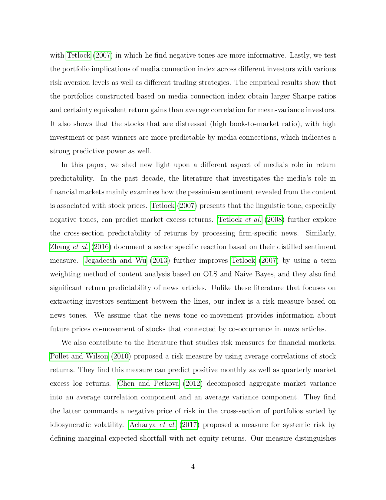
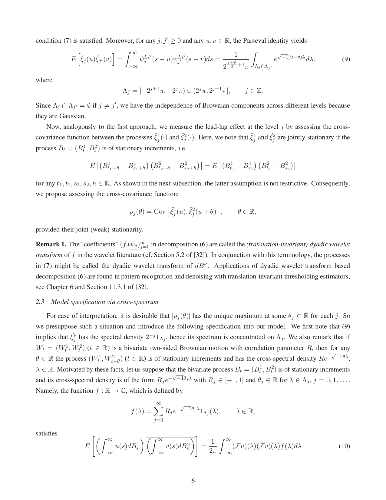
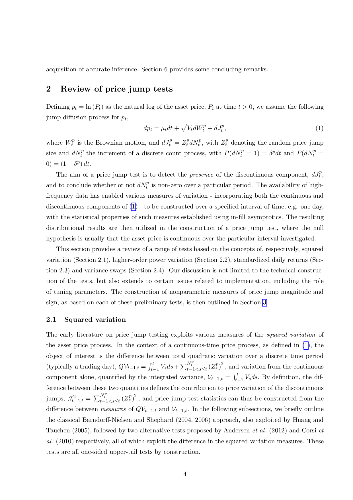
In this paper, we provide non-parametric statistical tools to test
stationarity of microstructure noise in general hidden Ito semimartingales, and
discuss how to measure liquidity risk using high frequency financial data. In
particular, we investigate the impact of non-stationary microstructure noise on
some volatility estimators, and design three complementary tests by exploiting
edge effects, information aggregation of local estimates and high-frequency
asymptotic approximation. The asymptotic distributions of these tests are
available under both stationary and non-stationary assumptions, thereby enable
us to conservatively control type-I errors and meanwhile ensure the proposed
tests enjoy the asymptotically optimal statistical power. Besides it also
enables us to empirically measure aggregate liquidity risks by these test
statistics. As byproducts, functional dependence and endogenous microstructure
noise are briefly discussed. Simulation with a realistic configuration
corroborates our theoretical results, and our empirical study indicates the
prevalence of non-stationary microstructure noise in New York Stock Exchange.
-
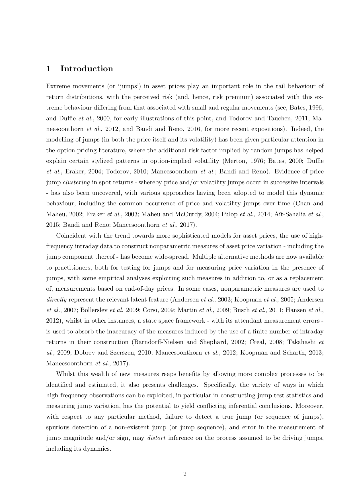
We conduct an extensive evaluation of price jump tests based on
high-frequency financial data. After providing a concise review of multiple
alternative tests, we document the size and power of all tests in a range of
empirically relevant scenarios. Particular focus is given to the robustness of
test performance to the presence of jumps in volatility and microstructure
noise, and to the impact of sampling frequency. The paper concludes by
providing guidelines for empirical researchers about which test to choose in
any given setting.
-
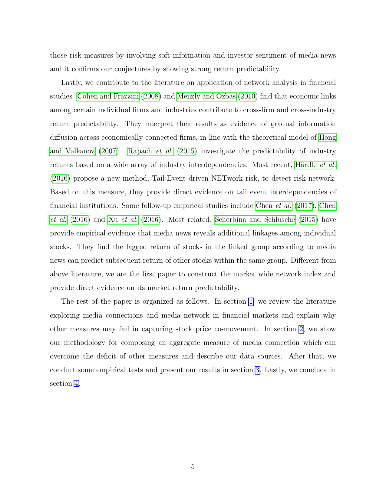
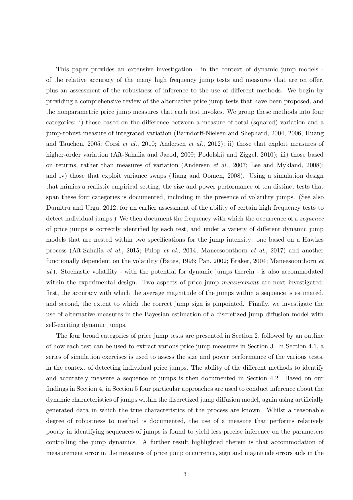
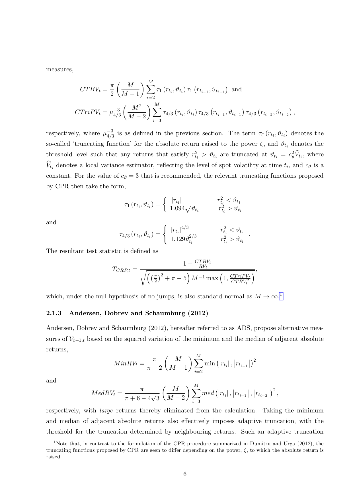
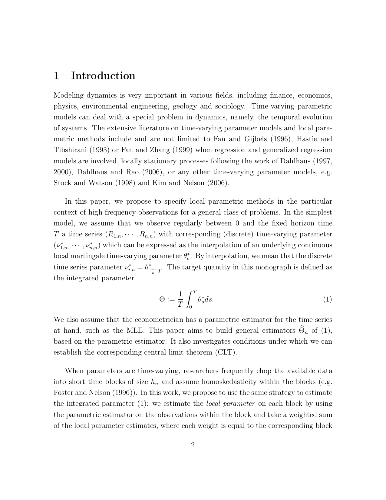
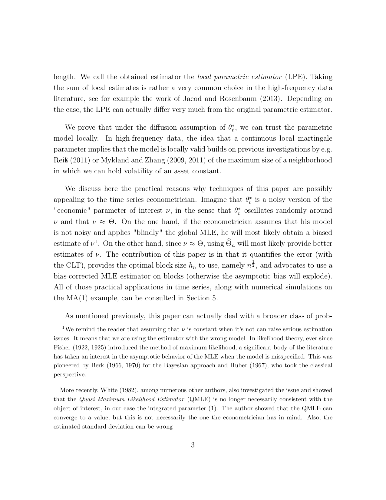
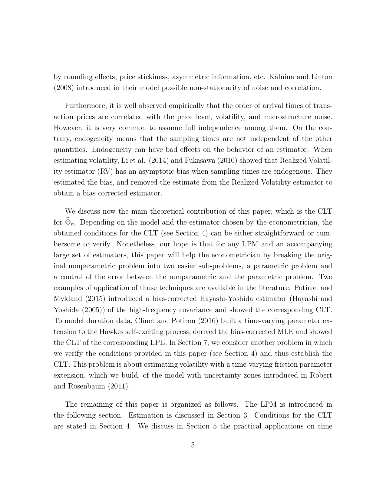
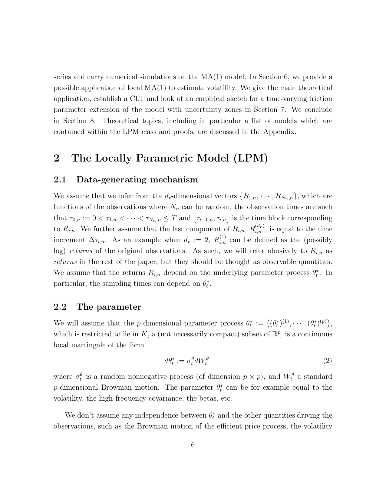
In this paper, we give a general time-varying parameter model, where the
multidimensional parameter possibly includes jumps. The quantity of interest is
defined as the integrated value over time of the parameter process $\Theta =
T^{-1} \int_0^T \theta_t^* dt$. We provide a local parametric estimator (LPE)
of $\Theta$ and conditions under which we can show the central limit theorem.
Roughly speaking those conditions correspond to some uniform limit theory in
the parametric version of the problem. The framework is restricted to the
specific convergence rate $n^{1/2}$. Several examples of LPE are studied:
estimation of volatility, powers of volatility, volatility when incorporating
trading information and time-varying MA(1).
-
We prove strong consistency and asymptotic normality of least squares
estimators for the subcritical Heston model based on continuous time
observations. We also present some numerical illustrations of our results.
-
Researchers developed the Economic Complexity Index (ECI) as a measure of the
overall sophistication of a country's products. They argued that this measure
explains economic growth better than the conventional variables such as human
capital. This paper suggests a simpler measure of production complexity, the
logarithm of product diversification, which has a natural foundation in
information theory: it measures the information needed to encode the knowledge
required to make a country's products. This measure explains well the income
differences between countries. It has a basic link with ECI that is strongly
supported by the data.
-
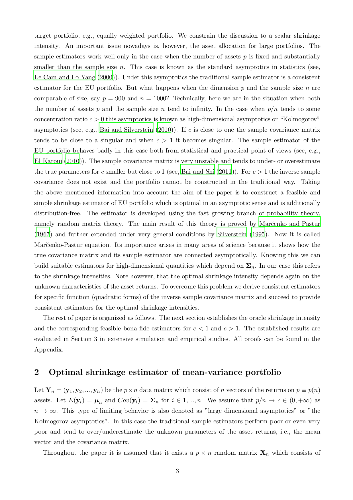
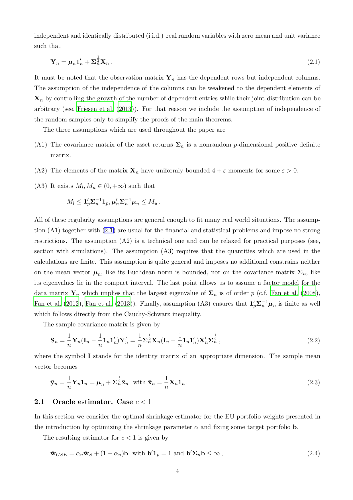
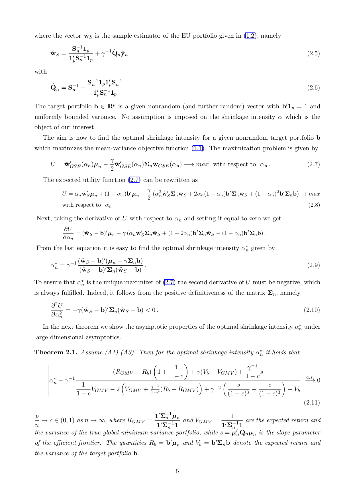
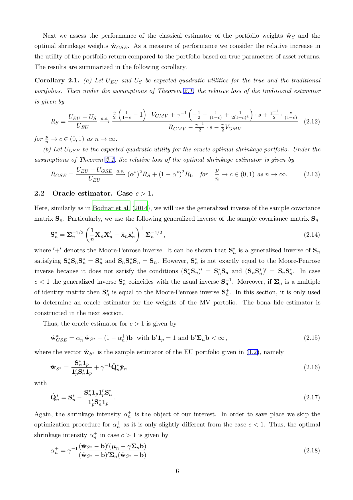
In this paper we estimate the mean-variance (MV) portfolio in the
high-dimensional case using the recent results from the theory of random
matrices. We construct a linear shrinkage estimator which is distribution-free
and is optimal in the sense of maximizing with probability $1$ the asymptotic
out-of-sample expected utility, i.e., mean-variance objective function for
several values of risk aversion coefficient which in particular leads to the
maximization of the out-of sample expected utility, to the maximization of the
out-of-sample Sharpe ratio, and to the minimization of the out-of-sample
variance. Its asymptotic properties are investigated when the number of assets
$p$ together with the sample size $n$ tend to infinity such that $p/n
\rightarrow c\in (0,+\infty)$. The results are obtained under weak assumptions
imposed on the distribution of the asset returns, namely the existence of the
fourth moments is only required. Thereafter we perform numerical and empirical
studies where the small- and large-sample behavior of the derived estimator is
investigated. The suggested estimator shows significant improvements over the
naive diversification and it is robust to the deviations from normality.
-
In this paper we derive the optimal linear shrinkage estimator for the
high-dimensional mean vector using random matrix theory. The results are
obtained under the assumption that both the dimension $p$ and the sample size
$n$ tend to infinity in such a way that $p/n \to c\in(0,\infty)$. Under weak
conditions imposed on the underlying data generating mechanism, we find the
asymptotic equivalents to the optimal shrinkage intensities and estimate them
consistently. The proposed nonparametric estimator for the high-dimensional
mean vector has a simple structure and is proven to minimize asymptotically,
with probability $1$, the quadratic loss when $c\in(0,1)$. When $c\in(1,
\infty)$ we modify the estimator by using a feasible estimator for the
precision covariance matrix. To this end, an exhaustive simulation study and an
application to real data are provided where the proposed estimator is compared
with known benchmarks from the literature. It turns out that the existing
estimators of the mean vector, including the new proposal, converge to the
sample mean vector when the true mean vector has an unbounded Euclidean norm.
-
Financial markets are notoriously complex environments, presenting vast
amounts of noisy, yet potentially informative data. We consider the problem of
forecasting financial time series from a wide range of information sources
using online Gaussian Processes with Automatic Relevance Determination (ARD)
kernels. We measure the performance gain, quantified in terms of Normalised
Root Mean Square Error (NRMSE), Median Absolute Deviation (MAD) and Pearson
correlation, from fusing each of four separate data domains: time series
technicals, sentiment analysis, options market data and broker recommendations.
We show evidence that ARD kernels produce meaningful feature rankings that help
retain salient inputs and reduce input dimensionality, providing a framework
for sifting through financial complexity. We measure the performance gain from
fusing each domain's heterogeneous data streams into a single probabilistic
model. In particular our findings highlight the critical value of options data
in mapping out the curvature of price space and inspire an intuitive, novel
direction for research in financial prediction.
-
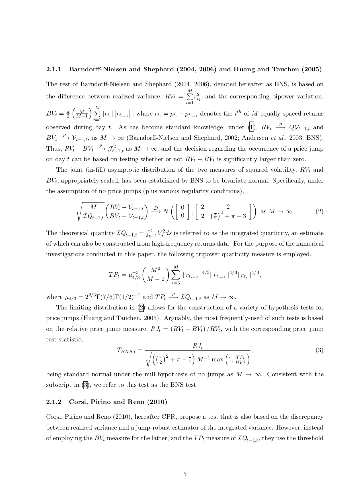
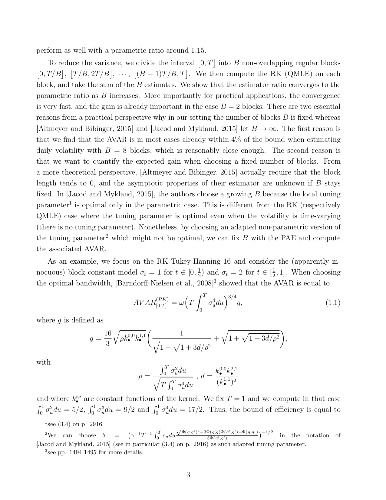
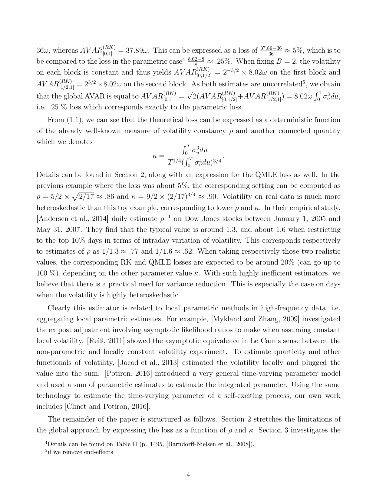
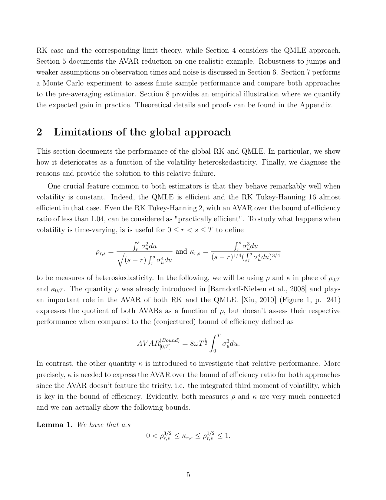
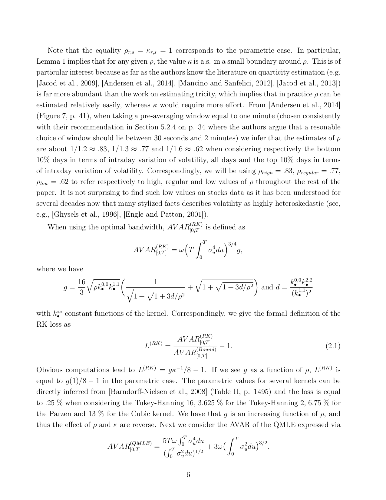
This paper shows how to carry out efficient asymptotic variance reduction
when estimating volatility in the presence of stochastic volatility and
microstructure noise with the realized kernels (RK) from [Barndorff-Nielsen et
al., 2008] and the quasi-maximum likelihood estimator (QMLE) studied in [Xiu,
2010]. To obtain such a reduction, we chop the data into B blocks, compute the
RK (or QMLE) on each block, and aggregate the block estimates. The ratio of
asymptotic variance over the bound of asymptotic efficiency converges as B
increases to the ratio in the parametric version of the problem, i.e. 1.0025 in
the case of the fastest RK Tukey-Hanning 16 and 1 for the QMLE. The impact of
stochastic sampling times and jump in the price process is examined carefully.
The finite sample performance of both estimators is investigated in
simulations, while empirical work illustrates the gain in practice.
-
Identifying behavior that is relatively invariant under different conditions
is a challenging task in far-from-equilibrium complex systems. As an example of
how the existence of a semi-invariant signature can be masked by the
heterogeneity in the properties of the components comprising such systems, we
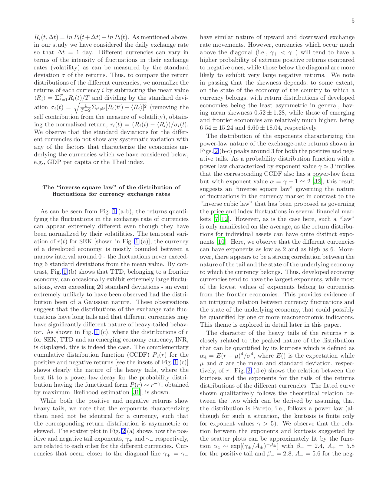
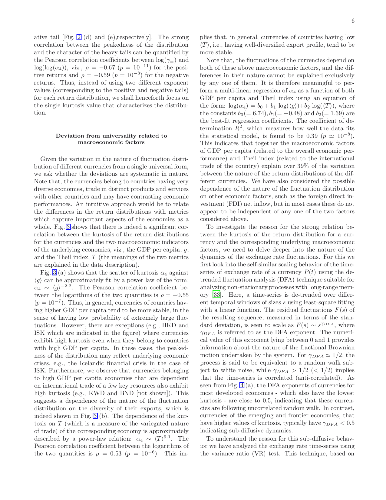
consider the exchange rate dynamics in the international currency market. We
show that the exponents characterizing the heavy tails of fluctuation
distributions for different currencies systematically diverge from a putative
universal form associated with the median value (~2) of the exponents. We
relate the degree of deviation of a particular currency from such an "inverse
square law" to fundamental macroscopic properties of the corresponding economy,
viz., measures of per capita production output and diversity of export
products. We also show that in contrast to uncorrelated random walks exhibited
by the exchange rate dynamics for currencies belonging to developed economies,
those of the less developed economies show characteristics of sub-diffusive
processes which we relate to the anti-correlated nature of the corresponding
fluctuations. Approaches similar to that presented here may help in identifying
invariant features obscured by the heterogeneous nature of components in other
complex systems.
-
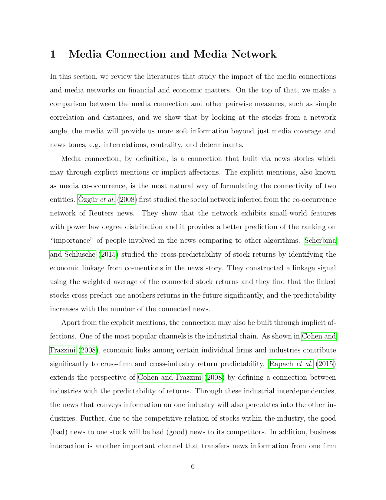
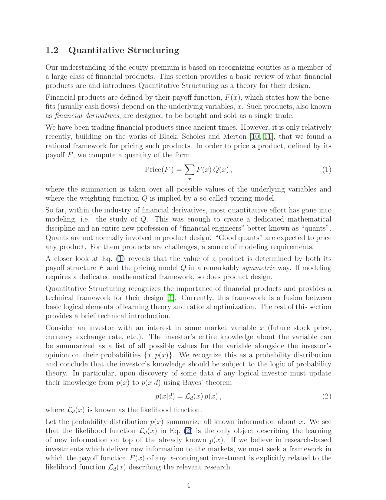
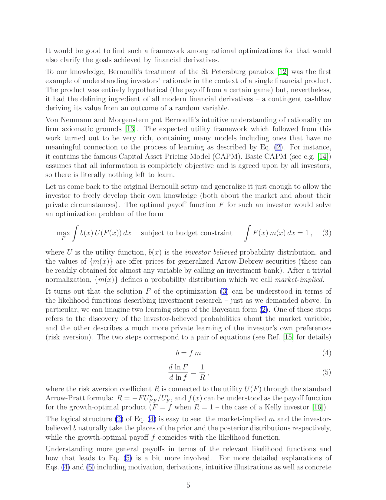
Financial markets provide a natural quantitative lab for understanding some
of the most advanced human behaviours. Among them is the use of mathematical
tools known as financial instruments. Besides money, the two most fundamental
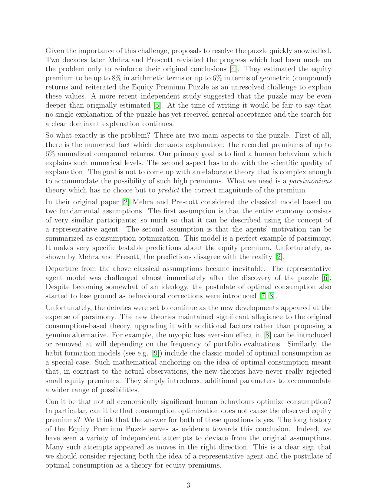
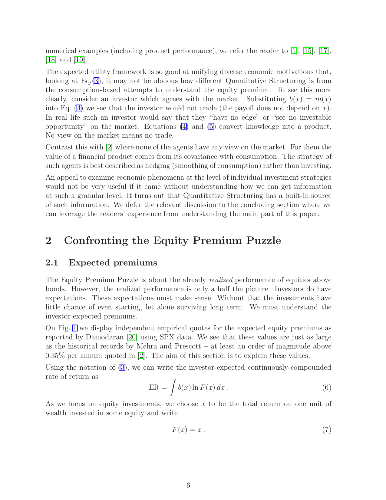
financial instruments are bonds and equities. More than 30 years ago Mehra and
Prescott found the numerical performance of equities relative to government
bonds could not be explained by consumption-based (mainstream) economic
theories. This empirical observation, known as the Equity Premium Puzzle, has
been defying mainstream economics ever since. The recent financial crisis
revealed an even deeper need for understanding financial products. We show how
understanding the rational nature of product design resolves the Equity Premium
Puzzle. In doing so we obtain an experimentally tested theory of product
design.
-
Using 1-min returns of Bitcoin prices, we investigate statistical properties
and multifractality of a Bitcoin time series. We find that the 1-min return
distribution is fat-tailed, and kurtosis largely deviates from the Gaussian
expectation. Although for large sampling periods, kurtosis is anticipated to
approach the Gaussian expectation, we find that convergence to that is very
slow. Skewness is found to be negative at time scales shorter than one day and
becomes consistent with zero at time scales longer than about one week. We also
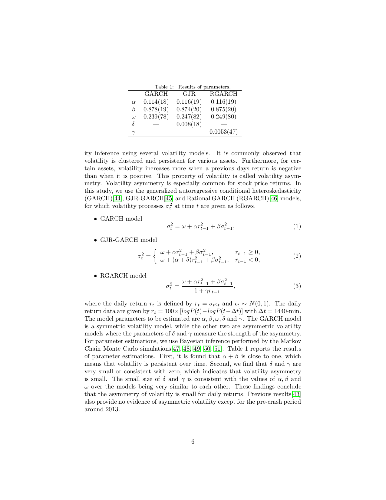
investigate daily volatility-asymmetry by using GARCH, GJR, and RGARCH models,
and find no evidence of it. On exploring multifractality using multifractal
detrended fluctuation analysis, we find that the Bitcoin time series exhibits
multifractality. The sources of multifractality are investigated, confirming
that both temporal correlation and the fat-tailed distribution contribute to
it. The influence of "Brexit" on June 23, 2016 to GBP--USD exchange rate and
Bitcoin is examined in multifractal properties. We find that, while Brexit
influenced the GBP--USD exchange rate, Bitcoin was robust to Brexit.
-
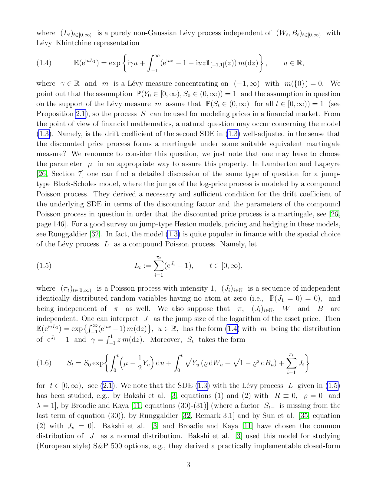
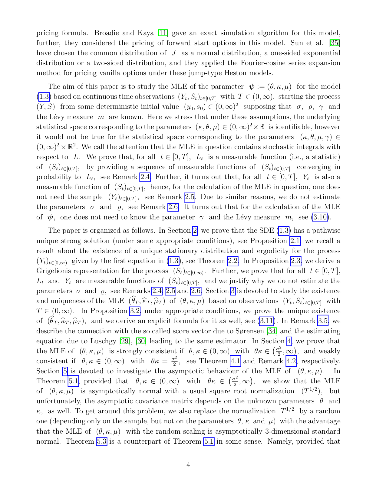
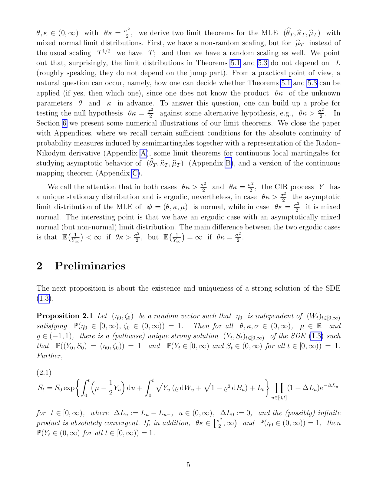
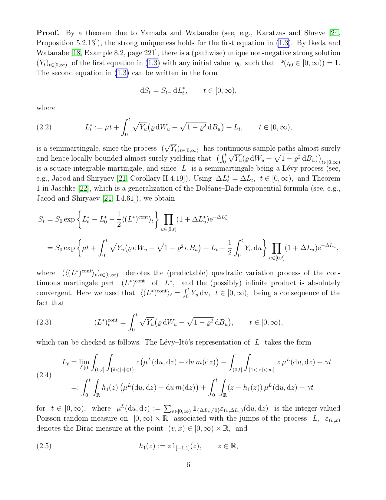
We study asymptotic properties of maximum likelihood estimators of drift
parameters for a jump-type Heston model based on continuous time observations,
where the jump process can be any purely non-Gaussian L\'evy process of not
necessarily bounded variation with a L\'evy measure concentrated on
$(-1,\infty)$. We prove strong consistency and asymptotic normality for all
admissible parameter values except one, where we show only weak consistency and
mixed normal (but non-normal) asymptotic behavior. It turns out that the
volatility of the price process is a measurable function of the price process.
We also present some numerical illustrations to confirm our results.
-
The liberalization of electricity markets and the development of renewable
energy sources has led to new challenges for decision makers. These challenges
are accompanied by an increasing uncertainty about future electricity price
movements. The increasing amount of papers, which aim to model and predict
electricity prices for a short period of time provided new opportunities for
market participants. However, the electricity price literature seem to be very
scarce on the issue of medium- to long-term price forecasting, which is
mandatory for investment and political decisions. Our paper closes this gap by
introducing a new approach to simulate electricity prices with hourly
resolution for several months up to three years. Considering the uncertainty of
future events we are able to provide probabilistic forecasts which are able to
detect probabilities for price spikes even in the long-run. As market we
decided to use the EPEX day-ahead electricity market for Germany and Austria.
Our model extends the X-Model which mainly utilizes the sale and purchase curve
for electricity day-ahead auctions. By applying our procedure we are able to
give probabilities for the due to the EEG practical relevant event of six
consecutive hours of negative prices. We find that using the supply and demand
curve based model in the long-run yields realistic patterns for the time series
of electricity prices and leads to promising results considering common error
measures.
-
To understand the relationship between news sentiment and company stock price
movements, and to better understand connectivity among companies, we define an
algorithm for measuring sentiment-based network risk. The algorithm ranks
companies in networks of co-occurrences, and measures sentiment-based risk, by
calculating both individual risks and aggregated network risks. We extract
relative sentiment for companies to get a measure of individual company risk,
and input it into our risk model together with co-occurrences of companies
extracted from news on a quarterly basis. We can show that the highest
quarterly risk value outputted by our risk model, is correlated to a higher
chance of stock price decline, up to 70 days after a risk measurement. Our
results show that the highest difference in the probability of stock price
decline, compared to the benchmark containing all risk values for the same
period, is during the interval from 21 to 30 days after a quarterly
measurement. The highest average probability of company stock price decline, is
found at a delay of 28 days, after a company has reached its maximum risk
value. The highest probability differences for a daily decline were calculated
to be 13 percentage points.
 This tutorial provides a gentle introduction to the particle Metropolis-Hastings (PMH) algorithm for parameter inference in nonlinear state-space models together with a software implementation in the statistical programming language R. We employ a step-by-step approach to develop an implementation of the PMH algorithm (and the particle filter within) together with the reader. This final implementation is also available as the package pmhtutorial in the CRAN repository. Throughout the tutorial, we provide some intuition as to how the algorithm operates and discuss some solutions to problems that might occur in practice. To illustrate the use of PMH, we consider parameter inference in a linear Gaussian state-space model with synthetic data and a nonlinear stochastic volatility model with real-world data.
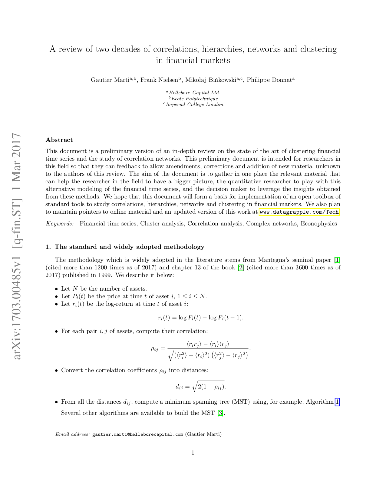


 We review the state of the art of clustering financial time series and the study of their correlations alongside other interaction networks. The aim of this review is to gather in one place the relevant material from different fields, e.g. machine learning, information geometry, econophysics, statistical physics, econometrics, behavioral finance. We hope it will help researchers to use more effectively this alternative modeling of the financial time series. Decision makers and quantitative researchers may also be able to leverage its insights. Finally, we also hope that this review will form the basis of an open toolbox to study correlations, hierarchies, networks and clustering in financial markets.
 We give complete algorithms and source code for constructing (multilevel) statistical industry classifications, including methods for fixing the number of clusters at each level (and the number of levels). Under the hood there are clustering algorithms (e.g., k-means). However, what should we cluster? Correlations? Returns? The answer turns out to be neither and our backtests suggest that these details make a sizable difference. We also give an algorithm and source code for building "hybrid" industry classifications by improving off-the-shelf "fundamental" industry classifications by applying our statistical industry classification methods to them. The presentation is intended to be pedagogical and geared toward practical applications in quantitative trading.
 In this paper, we introduce quantile coherency to measure general dependence structures emerging in the joint distribution in the frequency domain and argue that this type of dependence is natural for economic time series but remains invisible when only the traditional analysis is employed. We define estimators which capture the general dependence structure, provide a detailed analysis of their asymptotic properties and discuss how to conduct inference for a general class of possibly nonlinear processes. In an empirical illustration we examine the dependence of bivariate stock market returns and shed new light on measurement of tail risk in financial markets. We also provide a modelling exercise to illustrate how applied researchers can benefit from using quantile coherency when assessing time series models.
 In a very high-dimensional vector space, two randomly-chosen vectors are almost orthogonal with high probability. Starting from this observation, we develop a statistical factor model, the random factor model, in which factors are chosen at random based on the random projection method. Randomness of factors has the consequence that covariance matrix is well preserved in a linear factor representation. It also enables derivation of probabilistic bounds for the accuracy of the random factor representation of time-series, their cross-correlations and covariances. As an application, we analyze reproduction of time-series and their cross-correlation coefficients in the well-diversified Russell 3,000 equity index.
 We examine the effect of investor attention spillover on stock return predictability. Using a novel measure, the News Network Triggered Attention index (NNTA), we find that NNTA negatively predicts market returns with a monthly in(out)-of-sample R-square of 5.97% (5.80%). In the cross-section, a long-short portfolio based on news co-occurrence generates a significant monthly alpha of 68 basis points. The results are robust to the inclusion of alternative attention proxies, sentiment measures, other news- and information-based predictors, across recession and expansion periods. We further validate the attention spillover effect by showing that news co-mentioning leads to greater increases in Google and Bloomberg search volumes than unconditional news coverage. Our findings suggest that attention spillover in a news-based network can lead to significant stock market overvaluations, and especially when arbitrage is limited.
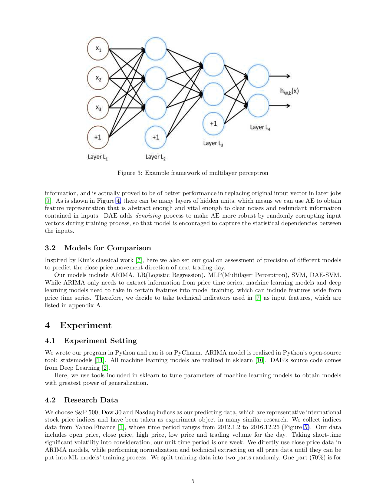
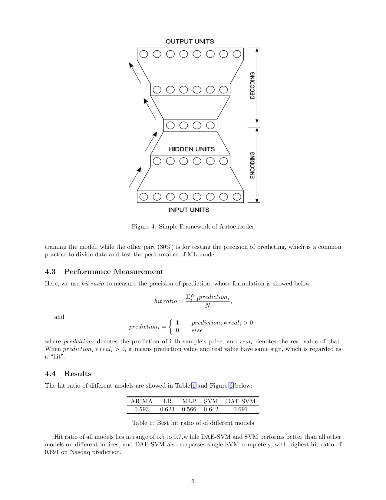 Precise financial series predicting has long been a difficult problem because of unstableness and many noises within the series. Although Traditional time series models like ARIMA and GARCH have been researched and proved to be effective in predicting, their performances are still far from satisfying. Machine Learning, as an emerging research field in recent years, has brought about many incredible improvements in tasks such as regressing and classifying, and it's also promising to exploit the methodology in financial time series predicting. In this paper, the predicting precision of financial time series between traditional time series models and mainstream machine learning models including some state-of-the-art ones of deep learning are compared through experiment using real stock index data from history. The result shows that machine learning as a modern method far surpasses traditional models in precision.
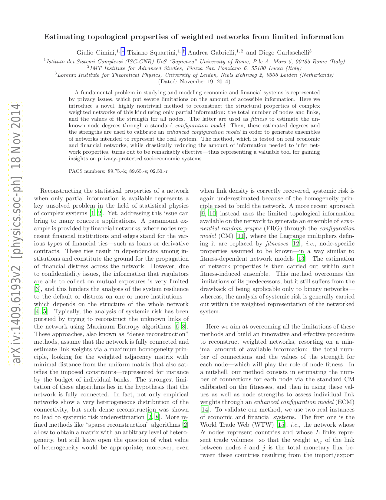
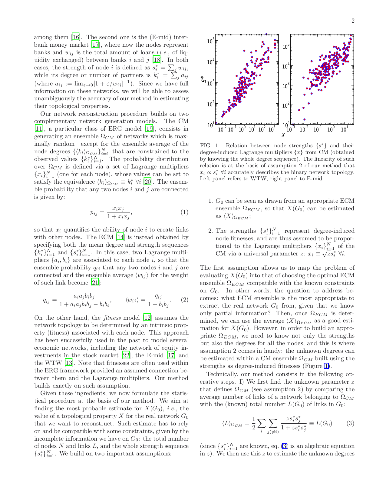
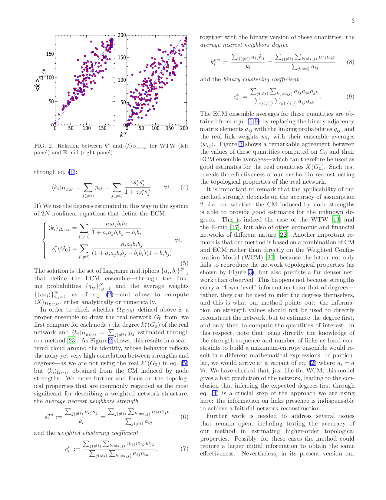
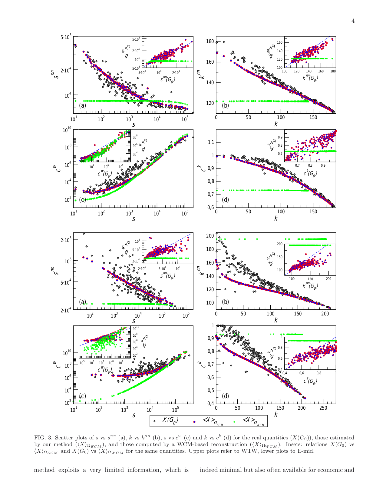
 A fundamental problem in studying and modeling economic and financial systems is represented by privacy issues, which put severe limitations on the amount of accessible information. Here we introduce a novel, highly nontrivial method to reconstruct the structural properties of complex weighted networks of this kind using only partial information: the total number of nodes and links, and the values of the strength for all nodes. The latter are used as fitness to estimate the unknown node degrees through a standard configuration model. Then, these estimated degrees and the strengths are used to calibrate an enhanced configuration model in order to generate ensembles of networks intended to represent the real system. The method, which is tested on real economic and financial networks, while drastically reducing the amount of information needed to infer network properties, turns out to be remarkably effective$-$thus representing a valuable tool for gaining insights on privacy-protected socioeconomic systems.
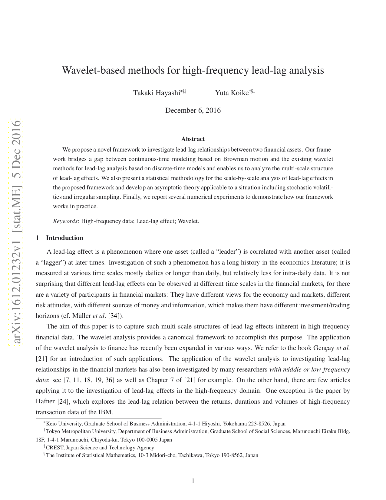
 We propose a novel framework to investigate lead-lag relationships between two financial assets. Our framework bridges a gap between continuous-time modeling based on Brownian motion and the existing wavelet methods for lead-lag analysis based on discrete-time models and enables us to analyze the multi-scale structure of lead-lag effects. We also present a statistical methodology for the scale-by-scale analysis of lead-lag effects in the proposed framework and develop an asymptotic theory applicable to a situation including stochastic volatilities and irregular sampling. Finally, we report several numerical experiments to demonstrate how our framework works in practice.
 In this paper, we provide non-parametric statistical tools to test stationarity of microstructure noise in general hidden Ito semimartingales, and discuss how to measure liquidity risk using high frequency financial data. In particular, we investigate the impact of non-stationary microstructure noise on some volatility estimators, and design three complementary tests by exploiting edge effects, information aggregation of local estimates and high-frequency asymptotic approximation. The asymptotic distributions of these tests are available under both stationary and non-stationary assumptions, thereby enable us to conservatively control type-I errors and meanwhile ensure the proposed tests enjoy the asymptotically optimal statistical power. Besides it also enables us to empirically measure aggregate liquidity risks by these test statistics. As byproducts, functional dependence and endogenous microstructure noise are briefly discussed. Simulation with a realistic configuration corroborates our theoretical results, and our empirical study indicates the prevalence of non-stationary microstructure noise in New York Stock Exchange.
 We conduct an extensive evaluation of price jump tests based on high-frequency financial data. After providing a concise review of multiple alternative tests, we document the size and power of all tests in a range of empirically relevant scenarios. Particular focus is given to the robustness of test performance to the presence of jumps in volatility and microstructure noise, and to the impact of sampling frequency. The paper concludes by providing guidelines for empirical researchers about which test to choose in any given setting.

 In this paper, we give a general time-varying parameter model, where the multidimensional parameter possibly includes jumps. The quantity of interest is defined as the integrated value over time of the parameter process $\Theta = T^{-1} \int_0^T \theta_t^* dt$. We provide a local parametric estimator (LPE) of $\Theta$ and conditions under which we can show the central limit theorem. Roughly speaking those conditions correspond to some uniform limit theory in the parametric version of the problem. The framework is restricted to the specific convergence rate $n^{1/2}$. Several examples of LPE are studied: estimation of volatility, powers of volatility, volatility when incorporating trading information and time-varying MA(1).
 In this paper we estimate the mean-variance (MV) portfolio in the high-dimensional case using the recent results from the theory of random matrices. We construct a linear shrinkage estimator which is distribution-free and is optimal in the sense of maximizing with probability $1$ the asymptotic out-of-sample expected utility, i.e., mean-variance objective function for several values of risk aversion coefficient which in particular leads to the maximization of the out-of sample expected utility, to the maximization of the out-of-sample Sharpe ratio, and to the minimization of the out-of-sample variance. Its asymptotic properties are investigated when the number of assets $p$ together with the sample size $n$ tend to infinity such that $p/n \rightarrow c\in (0,+\infty)$. The results are obtained under weak assumptions imposed on the distribution of the asset returns, namely the existence of the fourth moments is only required. Thereafter we perform numerical and empirical studies where the small- and large-sample behavior of the derived estimator is investigated. The suggested estimator shows significant improvements over the naive diversification and it is robust to the deviations from normality.
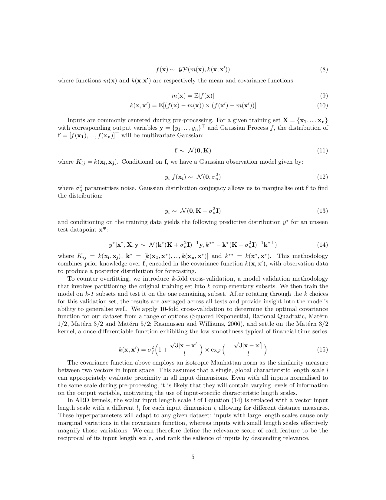
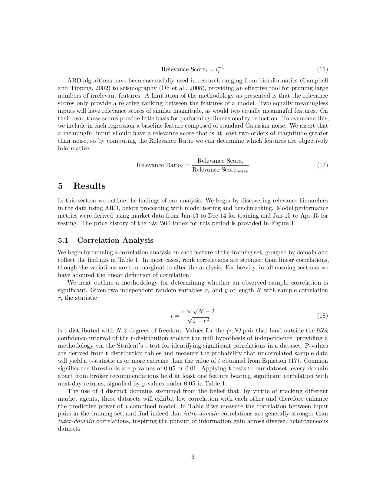 Financial markets are notoriously complex environments, presenting vast amounts of noisy, yet potentially informative data. We consider the problem of forecasting financial time series from a wide range of information sources using online Gaussian Processes with Automatic Relevance Determination (ARD) kernels. We measure the performance gain, quantified in terms of Normalised Root Mean Square Error (NRMSE), Median Absolute Deviation (MAD) and Pearson correlation, from fusing each of four separate data domains: time series technicals, sentiment analysis, options market data and broker recommendations. We show evidence that ARD kernels produce meaningful feature rankings that help retain salient inputs and reduce input dimensionality, providing a framework for sifting through financial complexity. We measure the performance gain from fusing each domain's heterogeneous data streams into a single probabilistic model. In particular our findings highlight the critical value of options data in mapping out the curvature of price space and inspire an intuitive, novel direction for research in financial prediction.
 This paper shows how to carry out efficient asymptotic variance reduction when estimating volatility in the presence of stochastic volatility and microstructure noise with the realized kernels (RK) from [Barndorff-Nielsen et al., 2008] and the quasi-maximum likelihood estimator (QMLE) studied in [Xiu, 2010]. To obtain such a reduction, we chop the data into B blocks, compute the RK (or QMLE) on each block, and aggregate the block estimates. The ratio of asymptotic variance over the bound of asymptotic efficiency converges as B increases to the ratio in the parametric version of the problem, i.e. 1.0025 in the case of the fastest RK Tukey-Hanning 16 and 1 for the QMLE. The impact of stochastic sampling times and jump in the price process is examined carefully. The finite sample performance of both estimators is investigated in simulations, while empirical work illustrates the gain in practice.
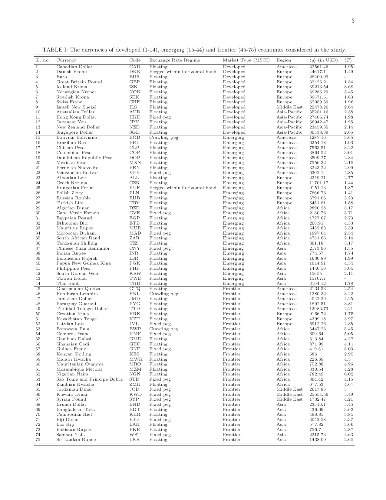
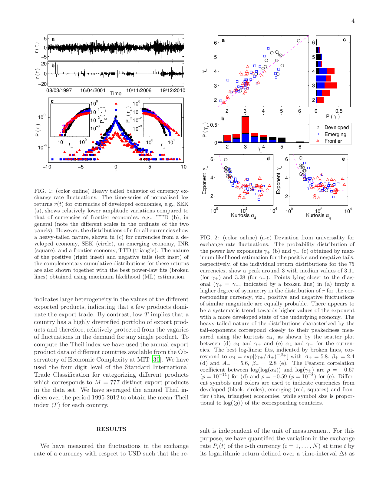
 Identifying behavior that is relatively invariant under different conditions is a challenging task in far-from-equilibrium complex systems. As an example of how the existence of a semi-invariant signature can be masked by the heterogeneity in the properties of the components comprising such systems, we consider the exchange rate dynamics in the international currency market. We show that the exponents characterizing the heavy tails of fluctuation distributions for different currencies systematically diverge from a putative universal form associated with the median value (~2) of the exponents. We relate the degree of deviation of a particular currency from such an "inverse square law" to fundamental macroscopic properties of the corresponding economy, viz., measures of per capita production output and diversity of export products. We also show that in contrast to uncorrelated random walks exhibited by the exchange rate dynamics for currencies belonging to developed economies, those of the less developed economies show characteristics of sub-diffusive processes which we relate to the anti-correlated nature of the corresponding fluctuations. Approaches similar to that presented here may help in identifying invariant features obscured by the heterogeneous nature of components in other complex systems.
 Financial markets provide a natural quantitative lab for understanding some of the most advanced human behaviours. Among them is the use of mathematical tools known as financial instruments. Besides money, the two most fundamental financial instruments are bonds and equities. More than 30 years ago Mehra and Prescott found the numerical performance of equities relative to government bonds could not be explained by consumption-based (mainstream) economic theories. This empirical observation, known as the Equity Premium Puzzle, has been defying mainstream economics ever since. The recent financial crisis revealed an even deeper need for understanding financial products. We show how understanding the rational nature of product design resolves the Equity Premium Puzzle. In doing so we obtain an experimentally tested theory of product design.
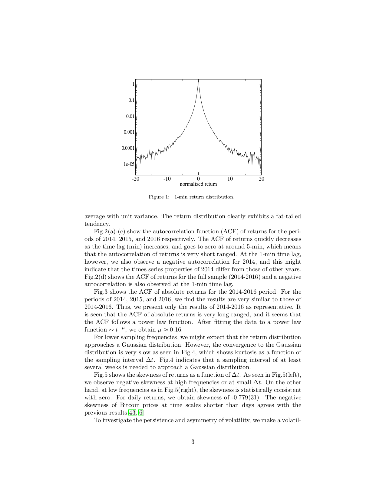
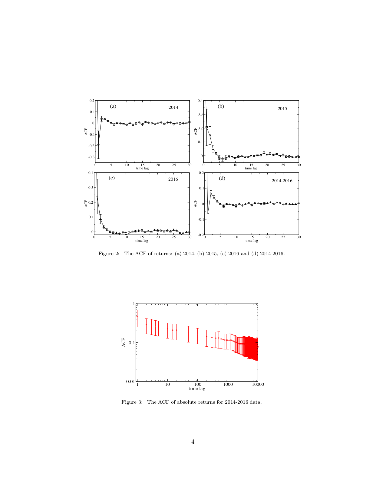
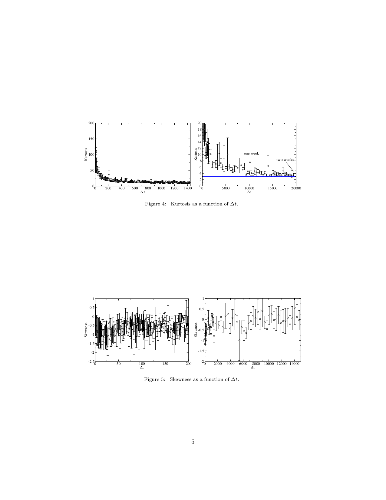
 Using 1-min returns of Bitcoin prices, we investigate statistical properties and multifractality of a Bitcoin time series. We find that the 1-min return distribution is fat-tailed, and kurtosis largely deviates from the Gaussian expectation. Although for large sampling periods, kurtosis is anticipated to approach the Gaussian expectation, we find that convergence to that is very slow. Skewness is found to be negative at time scales shorter than one day and becomes consistent with zero at time scales longer than about one week. We also investigate daily volatility-asymmetry by using GARCH, GJR, and RGARCH models, and find no evidence of it. On exploring multifractality using multifractal detrended fluctuation analysis, we find that the Bitcoin time series exhibits multifractality. The sources of multifractality are investigated, confirming that both temporal correlation and the fat-tailed distribution contribute to it. The influence of "Brexit" on June 23, 2016 to GBP--USD exchange rate and Bitcoin is examined in multifractal properties. We find that, while Brexit influenced the GBP--USD exchange rate, Bitcoin was robust to Brexit.
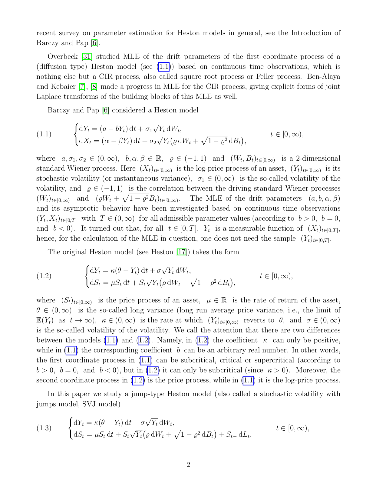
 We study asymptotic properties of maximum likelihood estimators of drift parameters for a jump-type Heston model based on continuous time observations, where the jump process can be any purely non-Gaussian L\'evy process of not necessarily bounded variation with a L\'evy measure concentrated on $(-1,\infty)$. We prove strong consistency and asymptotic normality for all admissible parameter values except one, where we show only weak consistency and mixed normal (but non-normal) asymptotic behavior. It turns out that the volatility of the price process is a measurable function of the price process. We also present some numerical illustrations to confirm our results.
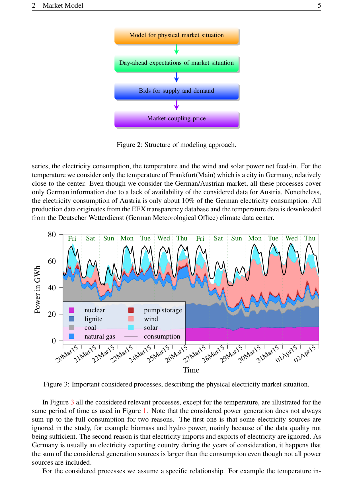
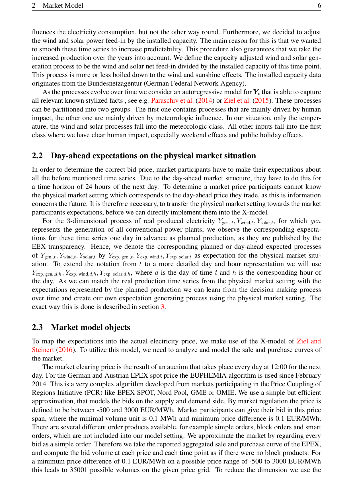 The liberalization of electricity markets and the development of renewable energy sources has led to new challenges for decision makers. These challenges are accompanied by an increasing uncertainty about future electricity price movements. The increasing amount of papers, which aim to model and predict electricity prices for a short period of time provided new opportunities for market participants. However, the electricity price literature seem to be very scarce on the issue of medium- to long-term price forecasting, which is mandatory for investment and political decisions. Our paper closes this gap by introducing a new approach to simulate electricity prices with hourly resolution for several months up to three years. Considering the uncertainty of future events we are able to provide probabilistic forecasts which are able to detect probabilities for price spikes even in the long-run. As market we decided to use the EPEX day-ahead electricity market for Germany and Austria. Our model extends the X-Model which mainly utilizes the sale and purchase curve for electricity day-ahead auctions. By applying our procedure we are able to give probabilities for the due to the EEG practical relevant event of six consecutive hours of negative prices. We find that using the supply and demand curve based model in the long-run yields realistic patterns for the time series of electricity prices and leads to promising results considering common error measures.